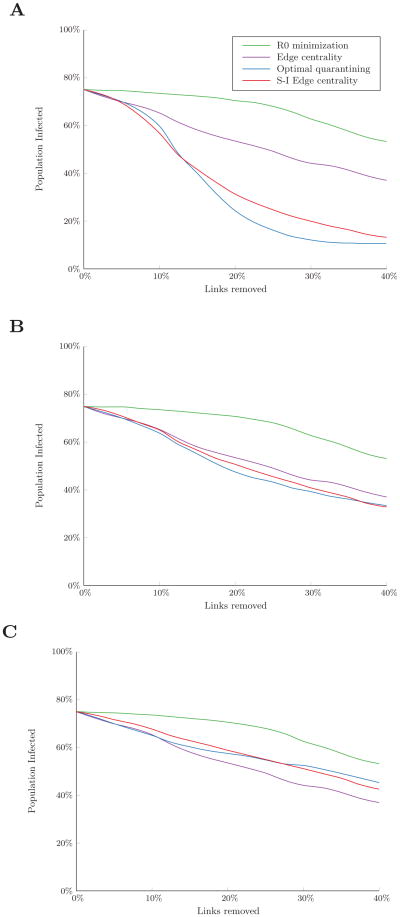
Figure 9.
Percent of the population infected over the course of an outbreak in the residential hotel network with varying levels of error in the identification of initially infected nodes. Shown for (A) perfect information; (B) a 25% false negative rate; and (C) a 50% false negative rate. Simulated with β/δ = 0.5 (R0 ≈ 5) and 10% of nodes initially infected. Results are the average of 300 random sets of initially infected nodes.

