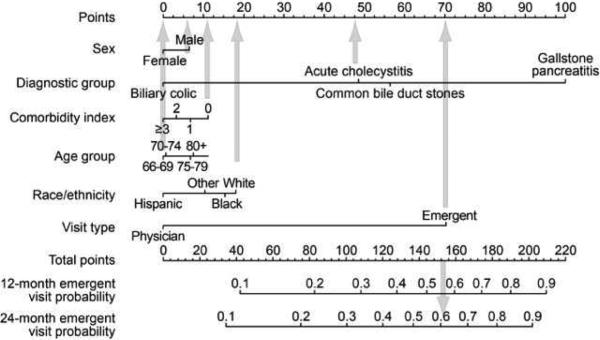
Figure 2.
Sample of risk calculation using the PREOP-Gallstones model nomogram. To use the nomogram, a vertical line is drawn from each factor to the corresponding position on the “Points” line. Points are summed for each factor and a line is drawn (downward arrow) from this position on the “Points” line to the “Emergent Visit Probability” lines to determine a patient's 12-month and 24-month risk for developing emergent gallstone-related complications.

