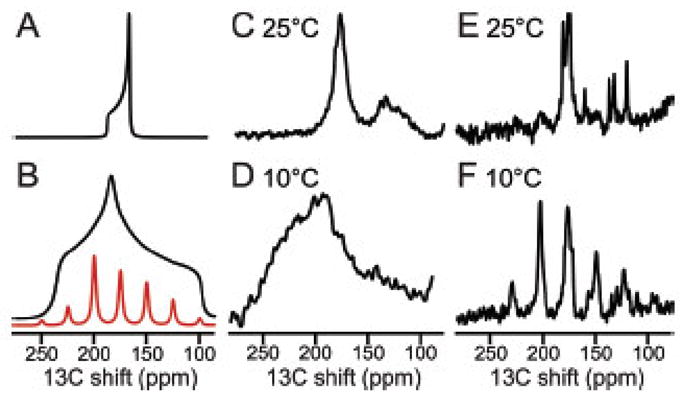
Figure 9.

13C solid-state NMR spectra of uniformly 13C/15N labeled MerFt in DMPC proteoliposomes. The majority of resonance intensity centered near 175 ppm is from 13C′ backbone sites. A. Spectrum simulated for a single 13C′ group in a transmembrane helix undergoing rotational diffusion around the lipid bilayer normal. B. As in Panel A except for a static 13C′ group in a peptide bond. The family of sidebands in panel B (red) would be observed under slow (5 kHz) MAS. C. and D. Experimental spectra obtained for a stationary sample when the protein undergoes fast rotational diffusion about the phospholipid bilayer normal C. or where the protein is immobile on the time scale of the static 13C′ CSA powder pattern D. E. and F. Experimental spectra obtained from a sample undergoing slow (5 kHz) MAS where the 13C′ CSA powder pattern is motionally averaged E, or at where a family of sidebands spanning the width of the static 13C′ CSA powder pattern F is observed in the absence of protein rotational diffusion. Comparisons of the powder pattern frequency breadth (A vs. B; C vs. D) or the presence of spinning sidebands (E vs. F) are diagnostic for the presence of fast rotational diffusion of the protein under the experimental conditions used to measure the CSA and DC powder patterns. From reference [58].
