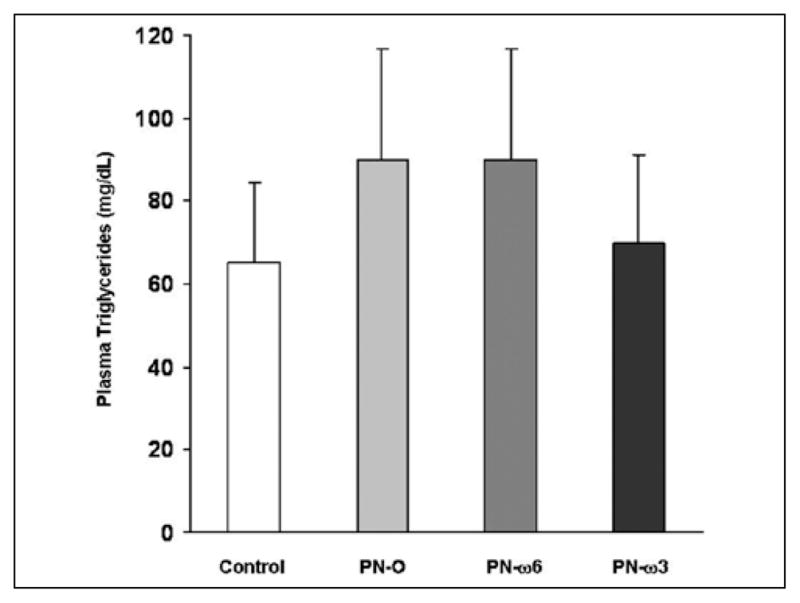
Figure 4.

Quantitative comparisons of plasma triglycerides. Values are presented as means ± SD for the 4 feeding groups (P = not significant, among all feeding groups). PN-O, oral, fat-free parenteral nutrition (PN) solution only; PN–ω-6, PN-O plus intraperitoneal (IP) ω-6 fatty acid (FA)–predominant supplements; PN–ω-3, PN-O plus IP ω-3 FA.
