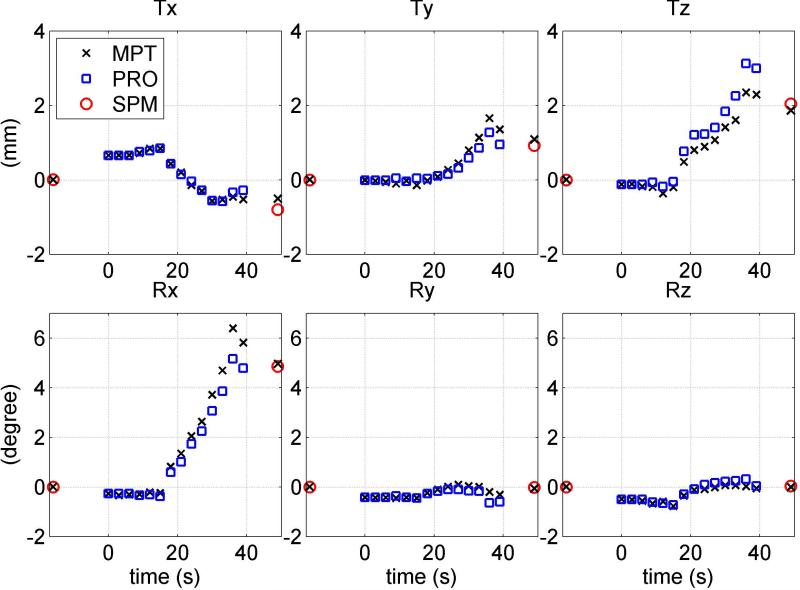
FIG. 4.
Motion trajectories for a representative X-rotation performed by one subject. Three translation (top row) and three rotation measurements (bottom row) of MPT (letter x) and PROMO (squares) are compared to image registration parameters (circle). MPT estimates of pose at GRE centers are shown at times t=-16 s and t=49 s. This figure illustrates involuntary motion during pre- and post-GRE acquisitions resulting in overestimation of MPT in Rx measurement. The MPT measurement from pre-GRE center to post-GRE center (black cross at t=49 s) matches better with SPM8 (red circle).

