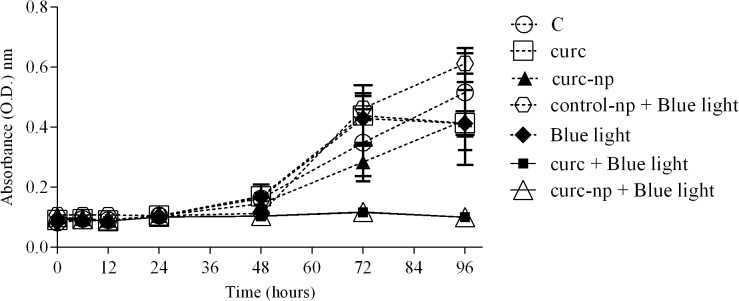
Fig 2. Fungal growth curve after aPI.

Fungal growth curve of aPI at optimal conditions (10 μg/mL of PS with 10 J/cm2 of B.L.). Each treatment per group was performed in triplicate and data are a composite of three independent experiments. The results are expressed as the mean ± SEM.
