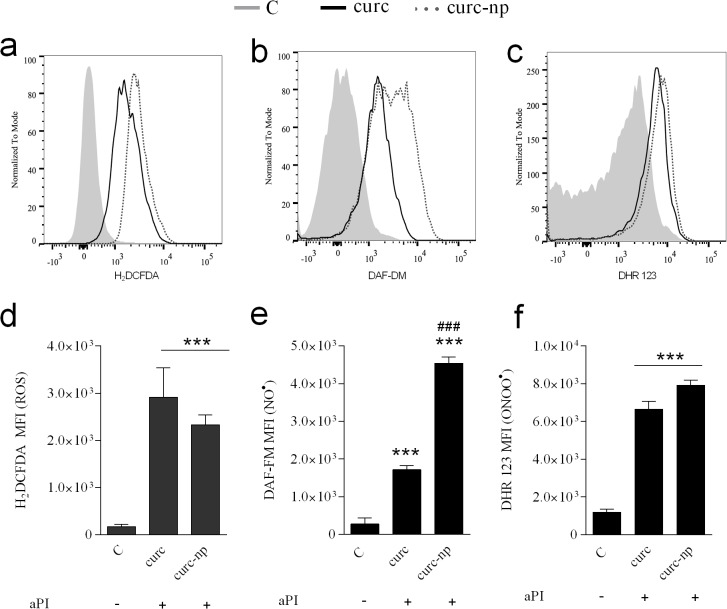
Fig 3. Evaluation of ROS and RNS production after aPI.
Detection of ROS levels following aPI, expressed as a (a) representative histogram and (d) cumulative bar plot. Detection of NO• levels following aPI, expressed as a (b) representative histogram and (e) cumulative bar plot. Detection of ONOO− levels following aPI, expressed as a (c) representative histogram and (f) cumulative bar plot. Dark toxicity controls did not differ significantly from untreated T. rubrum (data not represented). ***Compared to untreated control. ###Compared to curc group. MFI. Mean fluorescence intensity. ***,###p < 0.0001. Each treatment per group was performed in triplicate and are a composite of two independent experiments. The results are expressed as the mean ± SEM.

