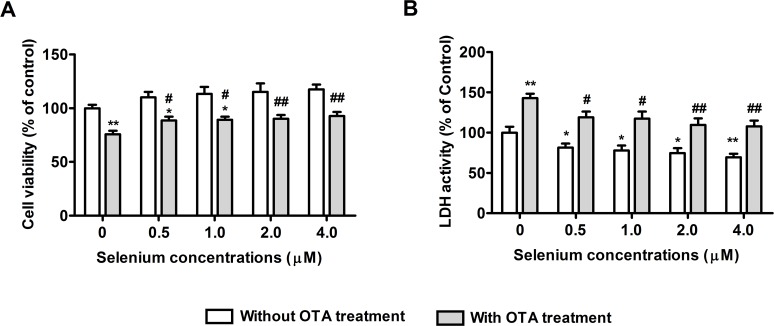
Fig 2. Protective effects of selenomethionine against OTA-induced cytotoxicity in PK15 cells.
Cell viability (A) and LDH activity (B) were assayed as described in the Materials and Methods section. Data are presented as mean ± SE (n = 3). Significance compared with control (without OTA or selenomethionine), *P < 0.05 and **P < 0.01. Within the OTA treatment group, significance compared with the control cells without selenomethionine treatment, #P < 0.05 and ##P < 0.01.

