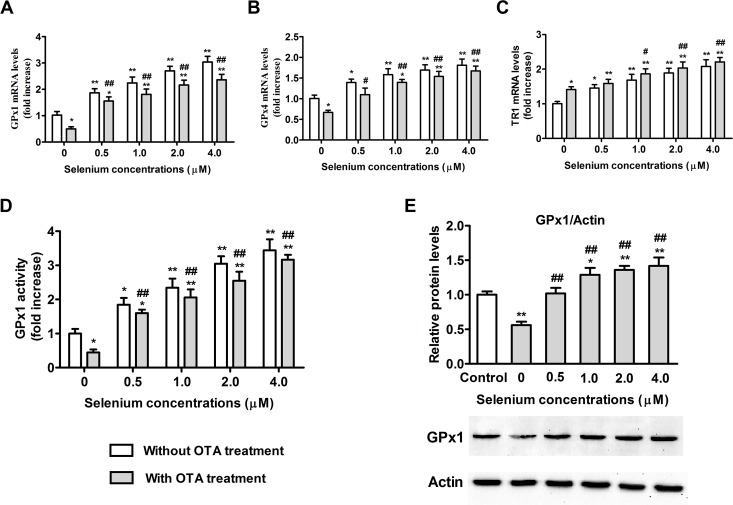
Fig 7. Effects of selenomethionine supplementation on selenoenzyme expression in PK15 cells.
GPx1 (A), GPx4 (B), and TR1 (C) mRNA levels, GPx1 activity (D), and GPx1 protein expression (E) were assayed as described in the Materials and Methods section. Data are presented as mean ± SE (n = 3). Significance compared with control (without OTA or selenomethionine), *P < 0.05 and **P < 0.01. Within the OTA treatment group, significance compared with the control cells without selenomethionine treatment, #P < 0.05 and ##P < 0.01.

