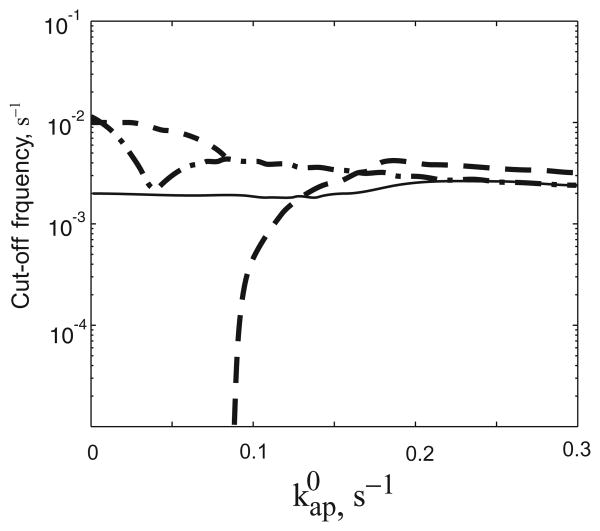
Fig. A3.
Comparison of the frequency response for the different designs. The simulations are done as follows. An input signal of the form (0.5001 + 0.5 sin[ωt]) is applied to the system for a period long enough to establish a steady-state oscillation. For each amplitude of the input signal , we calculate the cut-off frequency ω, at which the amplitude of the RR∼P response is half of its maximum amplitude at lowest frequency. Line designations are the same as Fig. 2A.

