
Fig. 3.
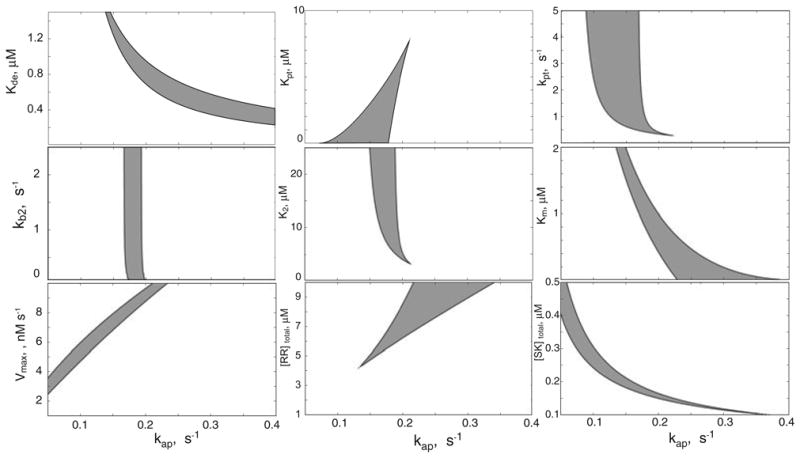
Robustness of bistability in monofunctional TCS. Each panel is a two-dimensional section of the parameter space in which bistability is manifested. In each case, the x-axis represents values for the autophosphorylation rate kph and the y-axis represents values for one of the other parameters in the model; each physically realizable region of bistability is shaded in grey for each two-dimensional section of parameter space. In each panel, the parameters not explicitly represented are held constant at their values used in Fig. 2 (and summarized in Table 1). The definitions of the parameters are given in Table 1 and in the Modeling procedures section: Kde – dissociation constant of the SK.RR dead-end complex, kpt – Michaelis–Menten constant of the phosphotransfer reaction, kpt – rate constant for the molecular activity of the phosphotransfer reaction, K2 – dissociation constant of the SK–RR∼P complex, kb2 – rate constant for the binding of SK to RR∼P, Km – Michaelis–Menten constant of the phosphatase reaction, Vmax – maximal velocity of the phosphatase reaction, [SK]total – total concentrations of SK, and [RR]total – total concentrations of RR.