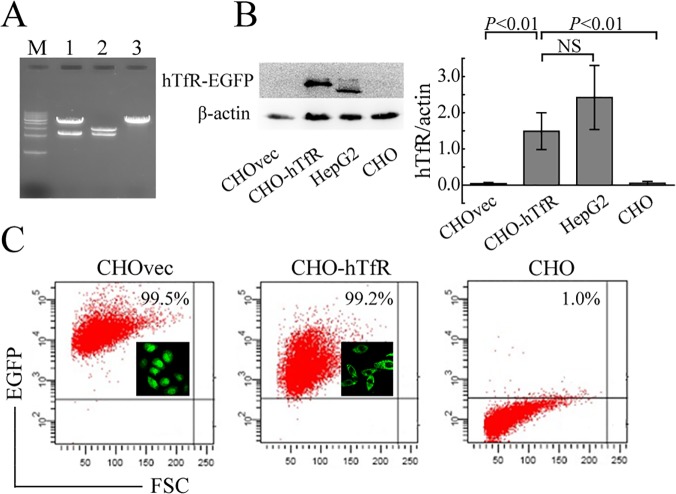
Fig 2. Construction and Expression of hTfR-EGFP in CHO cells.
(A) Sal I and BglII restriction enzyme digestion analysis. M: 1kb DNA ladder; lane 1: pEGFP-hTfR, lane 2: pGEM-T-hTfR, lane 3: pEGFP-C1. (B) Immunoblot analysis of hTfR expression in cells. Cell lysates were probed by mouse anti-human TfR mAb. Left: representative WB picture of 4 separate experiments was shown. Right: Densitometric analysis of hTfR levels of the western blots. P values were calculated on the basis of Dunnett-t test (NS, not significant). (C) EGFP expression in CHO cells was detected by FCM and fluorescence microscope (insert).

