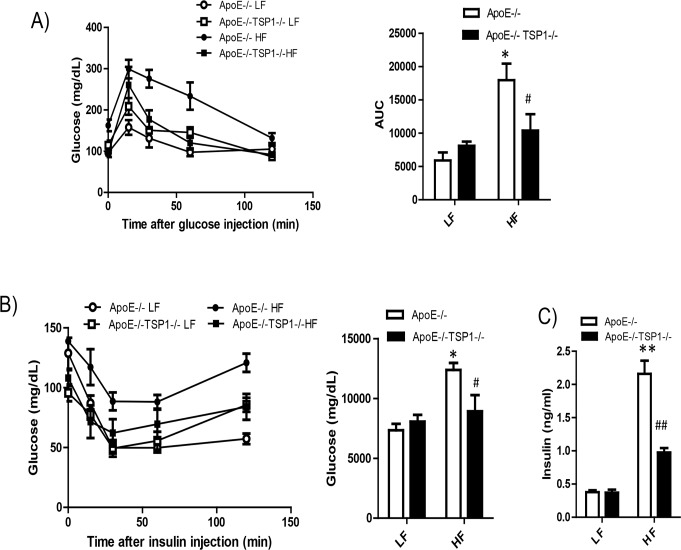
Fig 2. Obese ApoE-/-TSP1-/- mice had improved glucose tolerance and insulin sensitivity.
Male ApoE-/-TSP1-/- mice and ApoE-/-mice were fed LF or HF diet for 16 weeks. Intraperitoneal glucose tolerance (A) and insulin tolerance test (B) were measured. Changes in blood glucose levels were monitored over time. C) Plasma insulin levels were measured by ELISA. Data are represented as mean ± SE (n = 10 mice/group). *P<0.05 and ** P<0.01 vs. LF ApoE-/-. # P<0.05 and ## P<0.01 vs. HF ApoE-/-. AUC: area under the curve.

