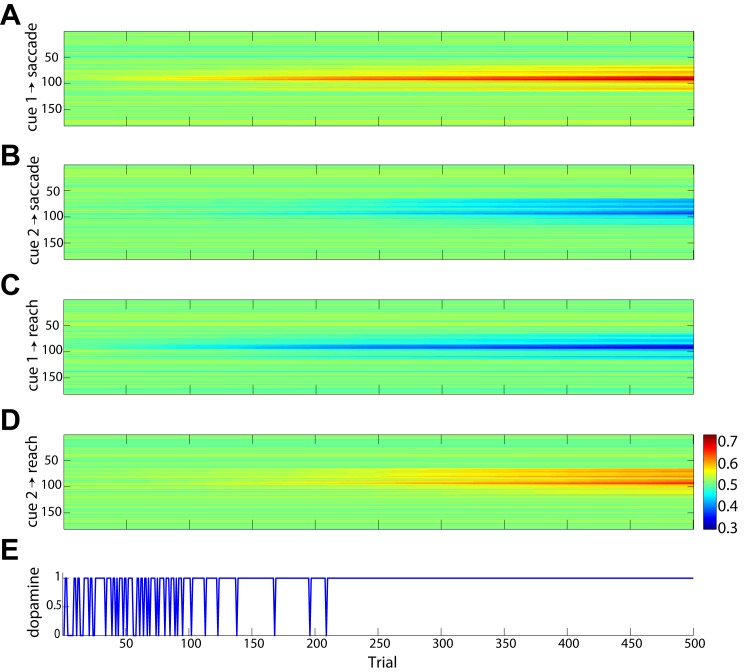
Fig 9. History of training on effector cues.
Plots A-D show the connection weights from neurons representing each cue (i.e., red and green) to the saccade (A-B) and reach (C-D) motor plan formation DNFs. There are 50 neurons selective for each cue and each motor plan formation field has 181 neurons, yielding four 50×181 connection weight matrices. Each matrix has been averaged over the cue selective neurons at each trial to show the mean connection weight to each motor plan formation field as training progresses. A: Mean connection weights from neurons representing the red cue (cue 1) to neurons in the saccade motor formation DNF from trials 1 to 500. B: Mean connection weights from green cue (cue 2) neurons to the saccade DNF. C: Mean connection weights from red cue neurons to the reach motor formation DNF. D: Mean connection weights from green cue neurons to the reach motor formation DNF. E: Success of each trial during training (0 = unsuccessful, 1 = successful).

