
Figure 3.
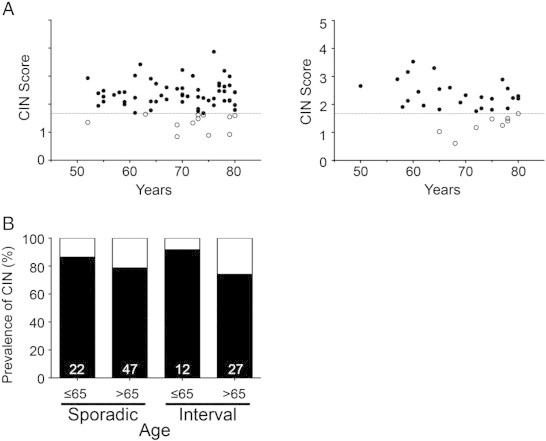
CIN-negative tumors are correlated with age, but not sex, in the proximal colon. (A) Scatterplots depicting the distribution of the CS values versus age for the proximal sporadic (left) and proximal interval (right) CRC samples. Samples with CS ≥ 1.68 are defined as CIN-positive (black), while those < 1.68 are CIN-negative (white). (B) Bar graphs depicting the prevalence of CIN (black) within sporadic and interval tumors based on age. The sample size of each group is indicated at the base of each bar.