
FIG. 4.
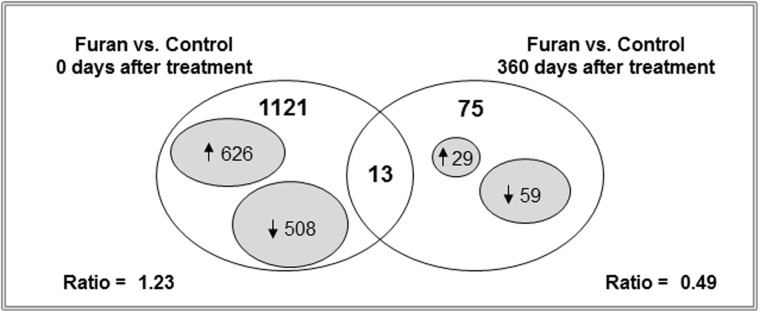
Whole-genome microarray analysis of gene expression in the livers of control rats and rats treated with furan. Venn diagram showing genes that were significantly different in the livers of control rats and rats treated with furan (P < 0.05, fold change > 2; n = 4).