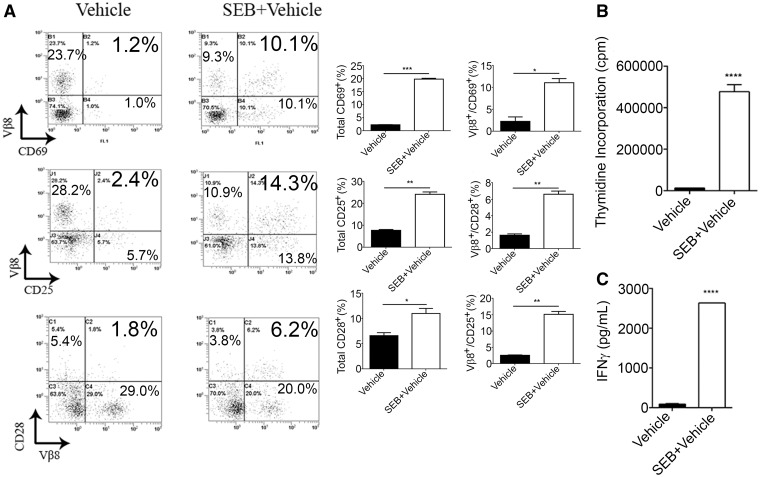
FIG. 3.
Effect of SEB activation in vitro. Splenocytes seeded at a density of 1 × 10⁶ cells were activated with 1 μg/ml of SEB. A, Twenty-four hours after activation, cells were harvested and triple stained in the following combinations: CD3+Vβ8+CD69+, CD3+Vβ8+CD25+, and CD3+Vβ8+CD28+. The representative dotplots shown are gated on CD3+ cells. B, Cell proliferation assay as measured by the incorporation of thymidine in splenocytes that were activated with SEB for 48 h. C, IFN-γ expression determined by ELISA. Samples were obtained from collecting the supernatants following SEB activation of splenocytes. Data are represented as mean ± SEM (n = 3) from 2 independent experiments. Statistical significance is indicated as follows: **P < 0.01, ***P < 0.001, ****P < 0.0001 (when compared with vehicle).

