FIG 6.
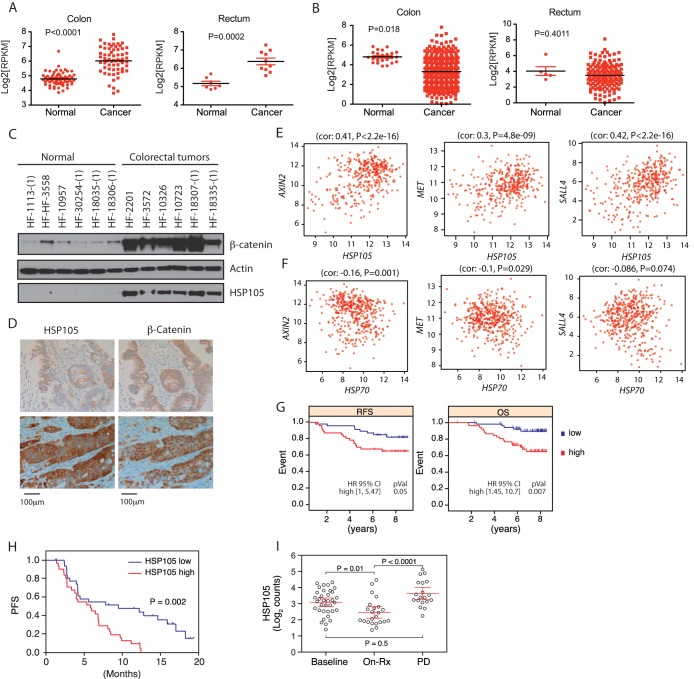
HSP105 is associated with a poor prognosis for cancer patients. (A and B) Transcript abundance of HSP105 (A) or HSP70 (B) measured by RNA-Seq in human colon and rectal cancers as well as normal tissues included in The Cancer Genome Atlas (TCGA) database. P values were derived from Student's t test for differences between cancer and normal samples. (C) Western blot analysis of HSP105 and β-catenin in human colorectal tumor samples and noncancerous colon tissue samples. (D) Representative immunohistochemical staining for HSP105 and β-catenin in human colorectal tumors (n = 66). β-Catenin staining is seen primarily in the membrane in HSP105 low-staining samples (top) and in the nucleus in HSP105 high-staining samples (bottom). (E and F) In colorectal tumor samples, HSP105 (E) but not HSP70 (F) mRNA levels show correlations (cor) with the transcription of Wnt target genes AXIN2, MET, and SALL4. (G) Kaplan-Meier curves representing the relapse-free survival (RFS) and overall survival (OS) rates of breast cancer patients with high or low HSP105 expression. pVal, P value. (H) Kaplan-Meier curve representing the progression-free survival (PFS) rates of patients in the BRIM2 study with high and low HSP105 mRNA expression. (I) HSP105 mRNA abundance in melanoma samples from the BRIM2 study as measured by NanoString software. Samples were collected prior to vemurafenib treatment (Baseline), at day 15 of treatment (On-Rx), or at disease progression (PD). P values were derived from a Tukey test comparing all groups.

