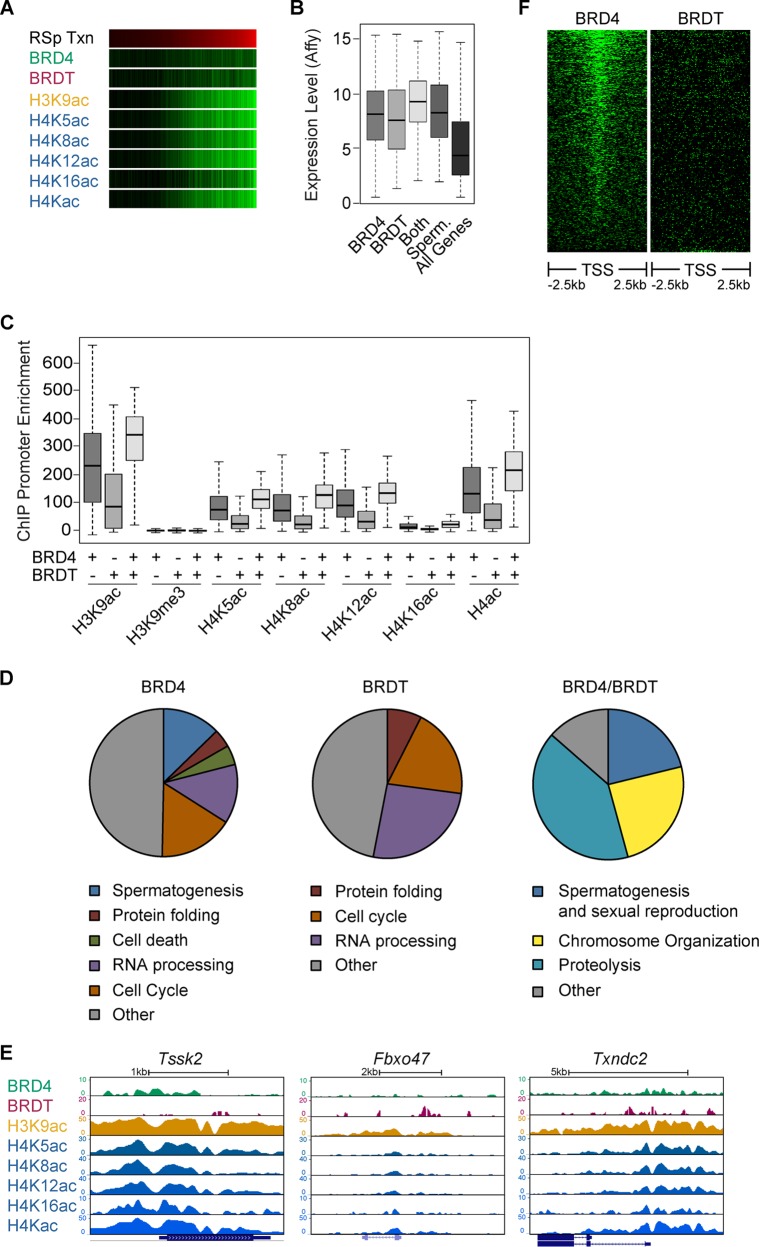
FIG 6.
BRD4 and BRDT bind to different subsets of transcriptionally active genes in round spermatids. (A) Heat map representation of ChIP-seq enrichment at promoters of all genes (green) compared to the levels of transcription (Txn) of these genes (red) in round spermatids. Brightness indicates higher levels of enrichment or transcription. (B) Box-and-whisker plot of transcription levels of genes that are bound by BRD4, BRDT, or both. Shown are the overall transcription levels of spermatogenesis-specific genes (Sperm.) and all genes, as a reference. (C) Box-and-whisker plot of enrichment levels of different histone PTMs at the gene promoters (1 kb upstream of the TSS) bound by BRD4, BRDT, or both (presence or absence of binding is indicated by a plus or minus sign, respectively, at the bottom). (D) Pie chart representations of GO terms of genes enriched for BRD4 (left), BRDT (middle), or both (right) in round spermatids. (E) ChIP-seq of BRD4, BRDT, and various histone PTMs at promoters of genes present in the topmost represented GO term category from the corresponding pie chart in panel D. UCSC-defined genes are shown at the bottom in blue. The y axis is ChIP enrichment (normalized to the input). The x axis is DNA sequence. (F) Heat map representation of BRD4 and BRDT enrichment around the TSS (±2.5 kb) of spermatogenesis-specific genes in round spermatids. Brightness indicates higher levels of enrichment.

