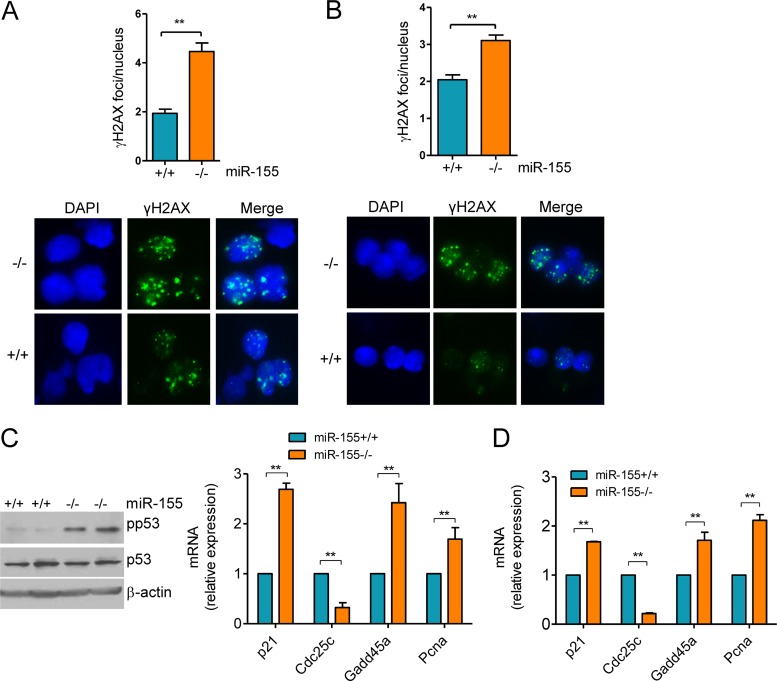
FIG 1.
Heightened formation of γH2AX foci and p53 activation in miR-155−/− mature B cells. (A) Mature B cells were harvested from miR-155 null and WT mice and grown in the presence of LPS–IL-4 for 96 h, and γH2AX was detected by IF. Quantification of γH2AX foci (50 nuclei counted per mouse) revealed a significantly higher DSB formation in miR-155 null than in WT control B cells (**, P ≤ 0.01, two-tailed Student t test). Data shown are mean ± standard deviation (SD) for the nine pairs of mice collected independently. A representative example of the γH2AX IF is also shown. (B) Mature B cells from NP-CGG-immunized mice were isolated and processed directly for γH2AX IF. Quantification of γH2AX foci confirmed the significantly more pronounced DSB formation in miR-155−/− B cells (P < 0.01, Student t test). Data shown are mean ± SD for the three pairs of mice collected independently. A representative example of the γH2AX IF is also shown. (C) Left, Western blot analysis of phospho-P53 (Ser18) levels in B cells from two pairs of miR-155+/+ and miR-155−/− mice shows a markedly higher p53 phosphorylation in cells lacking miR-155. Total p53 and B-actin immunoblotting confirmed that the changes noted are not related to distinct protein abundance. Right, real-time RT-PCR quantification of four p53 transcriptional targets (p21, Cdc25c, Gadd45a, and Pcna) defined a higher p53 activity in miR-155 null than in WT cells. (D) Similar real-time RT-PCR quantification was performed in B cells isolated from NP-CGG-immunized miR-155+/+ or miR-155−/− mice. In both instances, the expression of the p53 transcriptional targets was significantly influenced by miR-155 status (**, P ≤ 0.01, two-tailed Student t test). Note that Cdc25a expression is repressed by p53, whereas all other genes are induced. Data in panel C represent the mean ± standard error of the mean (SEM) of nine independent quantifications 18 mice); data in panel D are the mean ± SEM from three independent assays (6 mice). Data are displayed as relative expression, and all quantitative RT-PCRs were performed in triplicate.

