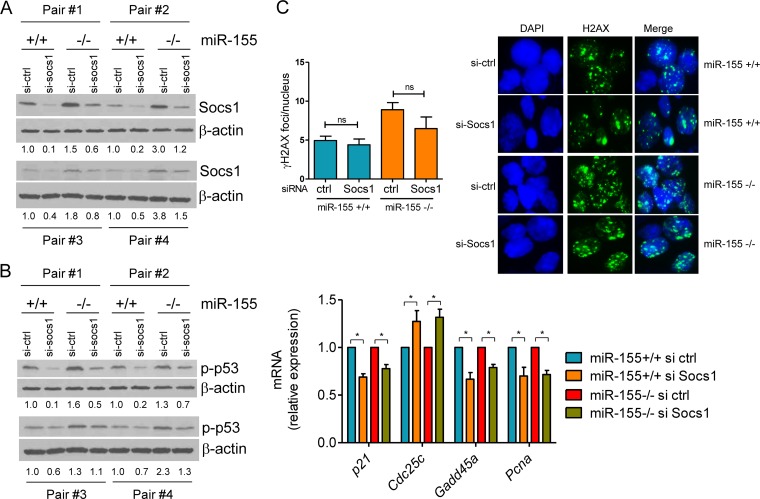
FIG 6.
miR-155 regulates the extent of p53 activity in mature B cells by targeting Socs1. (A) Western blot analysis of Socs1 expression demonstrates its higher expression in mature B cells from miR-155 null than from WT mice (for each pair of mice, compare si-ctrl in miR-155+/+ versus miR-155−/− mice) and their effective suppression by an siRNA-based strategy (for each mouse, compare si-ctrl to si-Socs1). (B) Left, Western blot analysis shows that Socs1 knockdown suppresses p53 phosphorylation (Ser18); right, real-time RT-PCR quantification of p53 transcriptional targets confirms the significant suppression of p53 activity upon Socs1 downregulation (*, P < 0.05, Student t test). Data shown are the mean ± SD from four independent assays (8 mice) performed in triplicate and are displayed as relative expression (si-ctrl/si-Socs1). Densitometric quantification is shown below the Western blots (A and B); data are normalized by β-actin and displayed relative to the values found in miR-155+/+ B cells transfected with the si-ctrl oligonucleotides. (C) Quantification of γH2AX by IF demonstrates that downregulation of Socs1 does not change the accumulation of DSB foci (ns, P = 0.21, Student t test). Data shown are mean ± SD of γH2AX foci (50 nuclei scored/sample) obtained from four pairs of miR-155+/+ and miR-155−/− littermates. A representative example of the γH2AX IF is also shown.

