FIG 7.
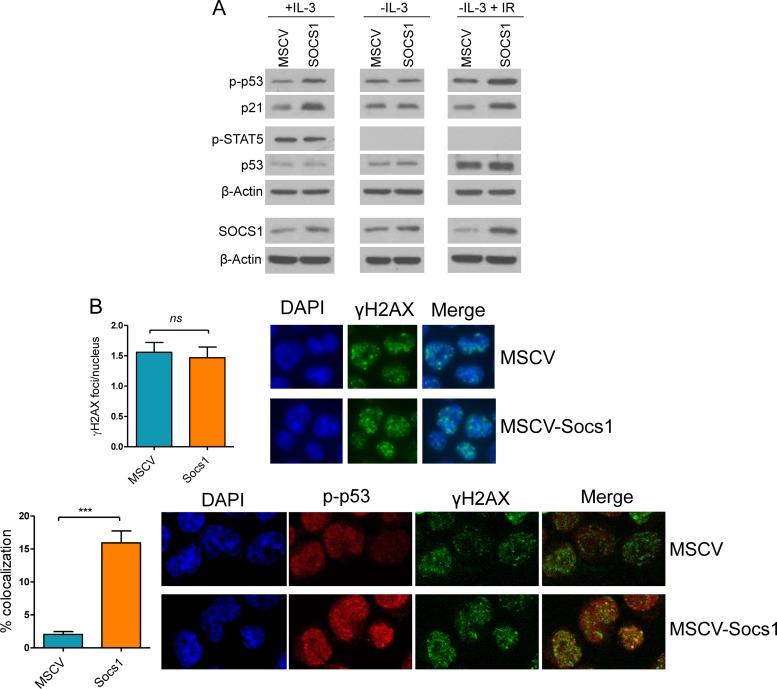
Socs1 modulates p53 phosphorylation, activity, and subcellular localization. (A) Left panel, Western blot analysis of BaF3 cells cultured in the presence of IL-3 demonstrates higher p53 phosphorylation (Ser18) and p21 expression (a surrogate measure of p53 activity) upon stable expression of Socs1. Middle panel, Western blot analysis demonstrates that withdrawal of IL-3 for 6 h abrogates the Socs1-mediated increase in p53 phosphorylation/activity. Right panel, BaF3 cells were cultured in the absence of IL-3 for 6 h and subjected to IR (5 Gy). Western blot analysis demonstrates higher p53 phosphorylation and p21 expression in BaF3 cells stably expressing Socs1 than in MSCV-only isogenic controls. Phospho-STAT5 expression confirms the effectiveness of IL-3 signaling (compare left and middle/right panels). For each panel, p53 Western blots indicate that Socs1 primarily influences phosphorylation and not total protein abundance. The Western blot at the bottom of each panel confirms the higher expression of Socs1 upon its stable expression in BaF3 cells. (B) Top, quantification of γH2AX by IF demonstrates that stable expression of Socs1 in BaF3 cells does not increase the formation of DSB foci following IR. Data shown are mean ± SD of foci per nucleus (150 nuclei counted in each cell type). A representative example of the γH2AX IF is also shown. Bottom, following IR, BaF3 cells stably expressing Socs1 display a significantly higher colocalization of p-p53 and γH2AX signals than the isogenic control cells. The quantification of p-p53 and γH2AX signal colocalization was performed using the plug-in module provided for ImageJ, with analysis of 128 and 114 cells for MSCV and MSCV-Socs1, respectively. The data shown are mean ± SD of the percentage of colocalizing signals in each cell type (***, P ≤ 0.001, two-tailed Student t test). All assays for this figure were confirmed in two or more biological replicates.

