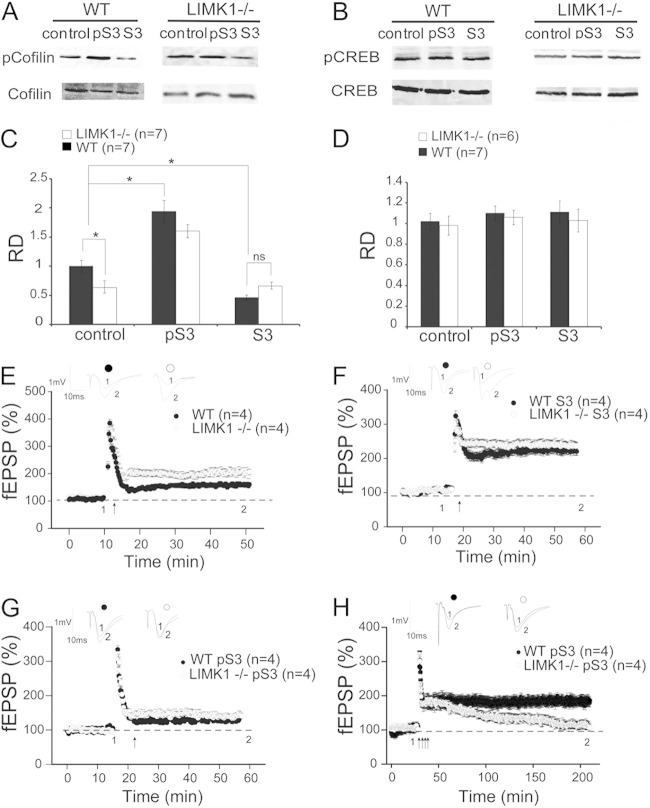
FIG 4.
Rescue of E-LTP but not L-LTP in LIMK1−/− mice by reduced cofilin activity. (A) Western blot analysis of total protein lysates prepared from hippocampal slices treated for 30 min with pS3 or S3 peptide or not treated (control) showing that pS3 increased the amount of phosphorylated cofilin (pCofilin) in WT and LIMK1−/− mice and that S3 decreased the amount of phosphorylated cofilin in WT but not LIMK1−/− mice. The level of total cofilin (A) and CREB or phosphorylated CREB (B) was not affected by either the pS3 or S3 peptide. (C) Summary graph of the Western blot shown in panel A showing a significant increase in the phosphorylated cofilin/cofilin relative density (RD) in slices from both WT and LIMK1−/− mice treated with pS3 peptide and a significant decrease in phosphorylated cofilin/cofilin in slices from WT but not LIMK1−/− mice treated with S3 peptide. Note that the basal phosphorylated cofilin/cofilin was significantly lower in slices from LIMK1−/− mice than those from WT mice. (D) Summary graph of the Western blot in panel B showing that neither the pS3 nor the S3 peptide had an effect on CREB or pCREB. (E) E-LTP induced by one train of HFS (100 Hz lasting 1 s) showing a significant enhancement of E-LTP in LIMK1−/− mice compared to that in WT mice. (F) E-LTP induced by one train of HFS (100 Hz lasting 1 s) in hippocampal slices treated with S3 peptide showing that the E-LTP in WT mice was increased to the level in LIMK1−/− mice. The S3 peptide had no effect on LIMK1−/− mice. (G) E-LTP induced by one train of HFS (100 Hz lasting 1 s) in hippocampal slices treated with pS3 peptides showing that enhanced E-LTP in LIMK1−/− mice was reduced to the level found in WT mice. The pS3 peptide had no effect on slices from WT mice. (H) L-LTP induced by four trains of HFS (100 Hz each lasting 1 s at 20-s intertrain intervals) showing that the pS3 peptide did not rescue the L-LTP deficit in LIMK1−/− mice. Traces above the graphs are representative responses taken from the indicated time points. Representative traces shown above the graphs were taken at the time points indicated by their respective numbers (1 and 2). Dashed lines indicate 100% and are shown for reference. Error bars represent SEMs. Arrows, LTP-inducing protocols; *, P < 0.05; ns, no significant difference; n, number of independent experiments (A to D) or number of animals (E to H).

