
Figure 4. Example of Simulation Approach to Help Validate and Assess Robustness of Time-Varying Connectivity Results.
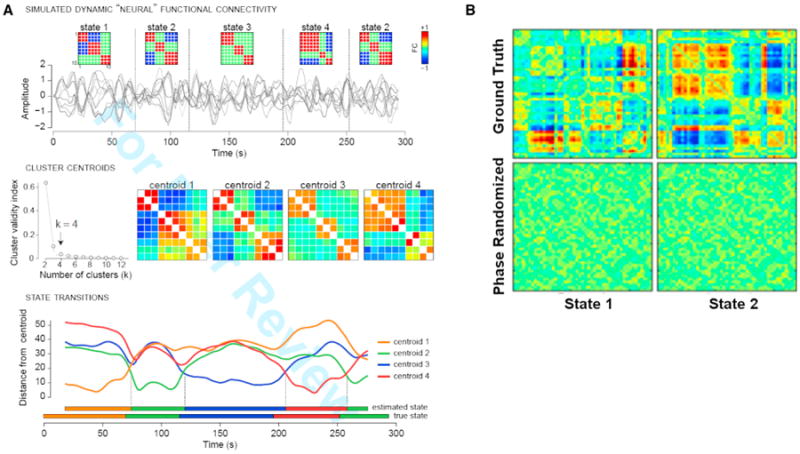
(A) Validation of clustering approach with simulated data. (Top row) Simulated fMRI time series for ten nodes are generated under a model of dynamic neural connectivity where 4 states are possible (state 2 repeats). Simulation parameters (TR = 2 s, 148 volumes) are matched to experimental data; connectivity states are modeled after clusters observed in real data. (Middle row) Windowed covariance matrices are estimated from the simulated time series and are subjected to k-means clustering with the L1 distance metric. The elbow criterion correctly identifies k = 4 clusters, and cluster centroids show high similarity to the true states. (Bottom row) The distance of each window to each cluster centroid. The assignment of individual windows to states is very accurate. Distances and state assignments are plotted at the time point corresponding to the window center.
(B) Original dynamic functional network connectivity states (top) and results after phase randomization (bottom) as in Handwerker et al. (2012) look random (not at all like the top row) and thus show no evidence of spurious structure (Damaraju et al., 2014). Figure modified and reprinted with permission from Allen et al. (2014) and Damaraju et al. (2014).