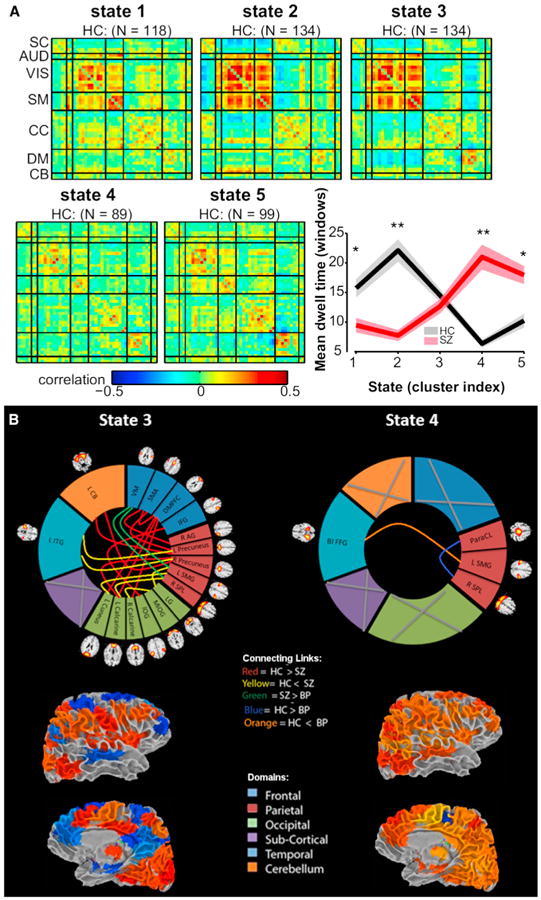
Figure 6. Summary of State Patterns and Significant Differences in Patients versus Controls.

(A) Five transient state connectivity patterns estimated from schizophrenia data. Patients spend significantly more time in the relatively less connected state 4 (red line in graph on right) whereas controls spend more time in states 1–3 (Damaraju et al., 2014).
(B) Dynamic functional network connectivity results suggesting specific states differentiate schizophrenia, bipolar, and healthy controls, and that most of these are tied to a single state in this case. (Top) Significant patient versus control differences within each state indicated by colored links. (Bottom) Surface view of the state in brain space for lateral and medial views of the brain. Figure modified reprinted with permission from Damaraju et al. (2014).
