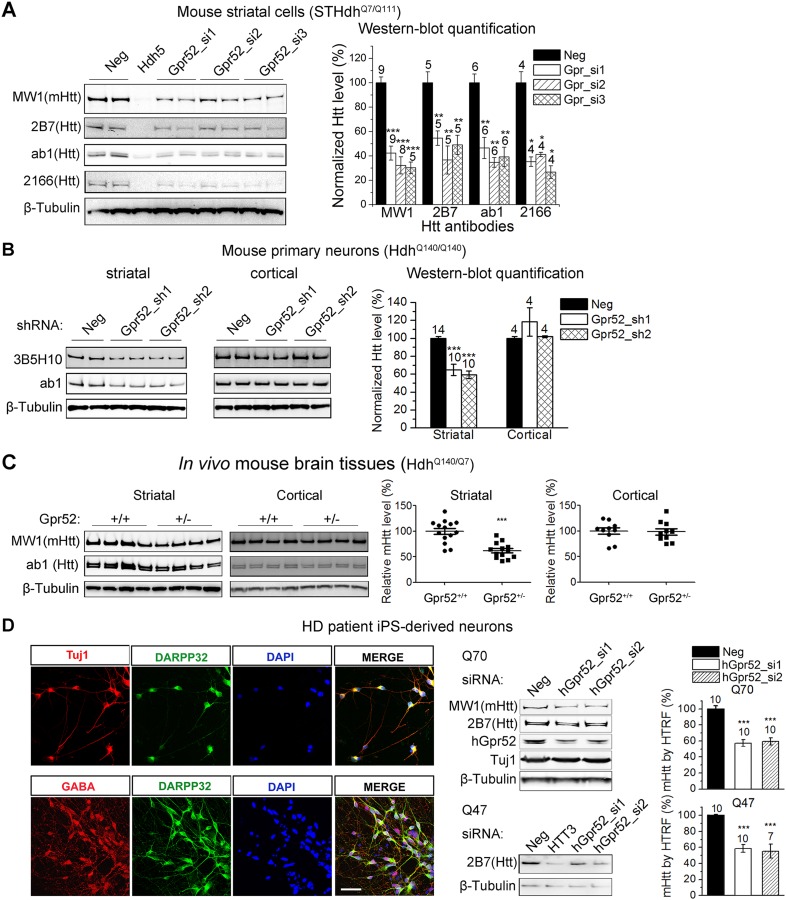
Figure 1. Gpr52 modulates Htt levels.
All data plots: average and S.E.M.; ‘*’: p < 0.05, ‘**’: p < 0.01, ‘***’: p < 0.001 by the two-tailed Mann–Whitney U test. The number on top of each bar indicates the biological replicate number. (A) Transfection of Gpr52 siRNAs (Gpr52_si1∼3) in the mouse striatal cells (STHdhQ7/Q111) lowers Htt levels, as detected by Htt antibodies MW1, 2166, ab1 and 2B7. MW1 is the polyQ antibody that detects only the mHtt protein, whereas 2166, 2B7 and ab1 detects both mHtt and wtHtt. Left panels: representative western-blots; Hdh5 is the Htt siRNA used as the positive control for Htt knock-down. Neg is the non-targeting siRNA used as the negative control. Right panel: western-blot quantification from multiple replicates. (B) Infection of lentiviruses expressing Gpr52 shRNAs (Gpr52_sh1∼2) lowers Htt in primary striatal but not cortical neurons cultured from HdhQ140/Q140 knock-in mice. Left panels: representative western-blots. Right panel: western-blot quantification for the normalized 3B5H10 signals from multiple replicates. (C) Heterozygous knockout of Gpr52 lowers Htt in vivo in the striata but not cortices of HdhQ140/Q7 knock-in mice in vivo. The mice were obtained by crossing the heterozygous Gpr52 knockout mice with the HdhQ140/Q140 knock-in mice. Littermates between 40 to 69 days of age were analyzed. Left panels: representative western-blots. Right panel: western-blot quantification of the normalized MW1 signals from multiple mouse samples. Each dot represents the signal from a single mouse. (D) Left panels: Immunostaining of HD patient iPS-derived striatal-like neurons. Differentiated neurons from HD patient's iPS cells express molecular markers for striatal medium spiny neurons: Tuj1, GABA and DARPP32. Scale bar: 50 μM. Right panels: Transfection of human Gpr52 siRNAs (hGpr52_si1∼2) in the HD patient iPS-derived neurons lowers Htt levels detected by both western-blots and HTRF. HTT3 is the Htt siRNA used as the positive control for Htt knock-down. Bar plot represents the normalized mHtt levels detected by HTRF using the 2B7/MW1 antibody pair.


