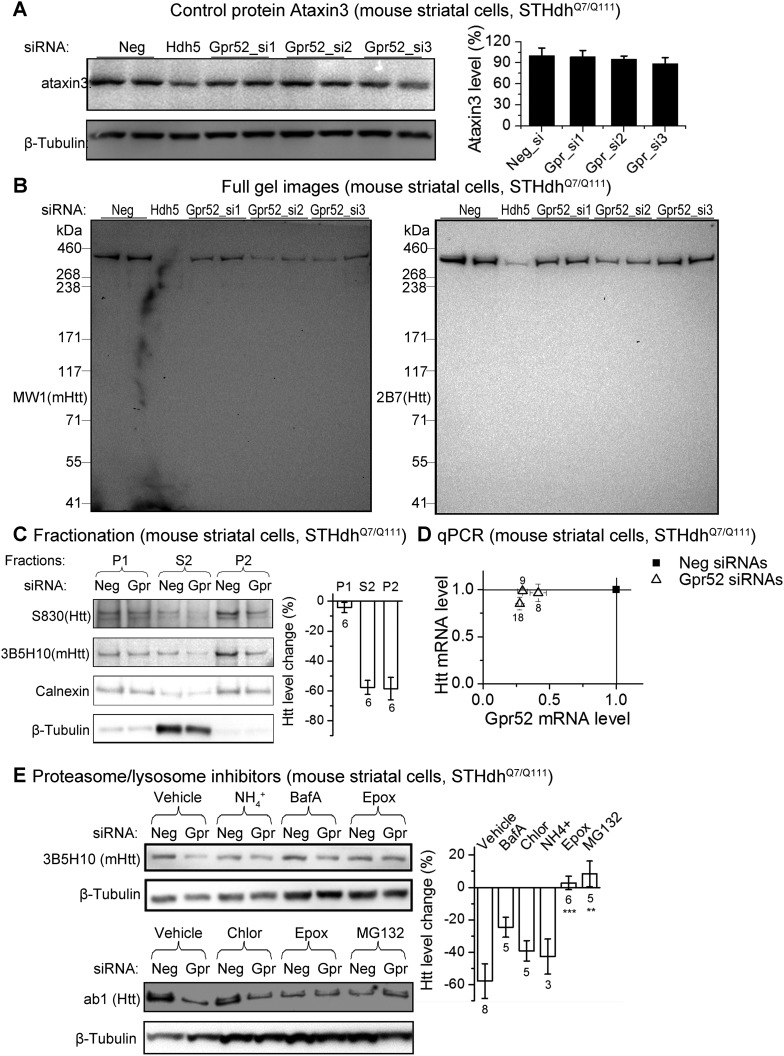
Figure 2. The Gpr52 mediated change of Htt levels is via protein degradation.
(A) Representative western-blots of STHdhQ7/Q111 cell lysates showing no reduction of Ataxin3 levels by Gpr52 knock-down. Bar graph: quantification of Atxn3 levels, n = 4. (B) Full membrane images of Htt blots showing no increase/appearance of lower molecular weight bands in the STHdh cell lysates, suggesting that the Htt reduction by Gpr52 knock-down is not due to protein cleavage modulations. (C) Representative western-blots for different biochemical fractions of the protein extract from STHdhQ7/Q111 cells transfected with non-targeting control siRNA (Neg) or the Gpr52 siRNA (Gpr52_si2). Gpr52 knock-down reduced Htt levels in both the P2 and S2 fractions, but not the P1 fraction. (D) In the Gpr52 siRNAs (triangles) transfected STHdhQ7/Q111 cells, Htt mRNA levels (Y-axis) and Gpr52 mRNA (X-axis) levels were measured by qPCR. Both the Gpr52 siRNAs and the Htt siRNAs show substantial knock-down of their targets, whereas the Gpr52 knock-down by Gpr52 siRNAs do not reduce Htt mRNA levels. No reverse-transcriptase control samples have been assayed to eliminate potential contaminations from genomic DNA. (E) Left: representative western-blots of STHdhQ7/Q111 cells transfected with non-targeting control siRNA (Neg) or the Gpr52 siRNA (Gpr52_si2) with or without proteasome or autophagy inhibitors. Right: the bar plot of western-blot quantification of the Htt level change by Gpr52 siRNA transfection with each compound treatment.

