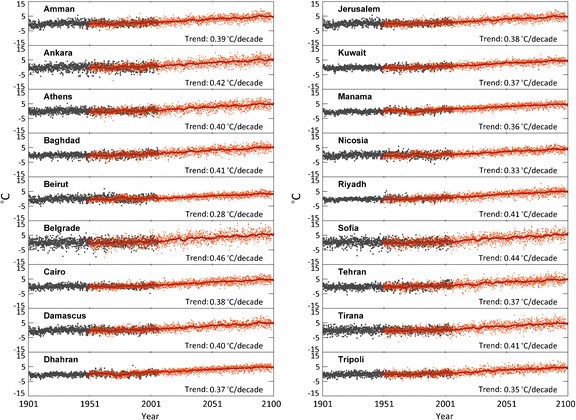
Fig. 4.

Time series of mean monthly temperature anomalies relative to the reference period (1961–1990) at 18 locations (Fig. S5). CRU data (grey) represent past and recent conditions; PRECIS data (red) represent recent and future conditions, and the red line shows the 5-year running average
