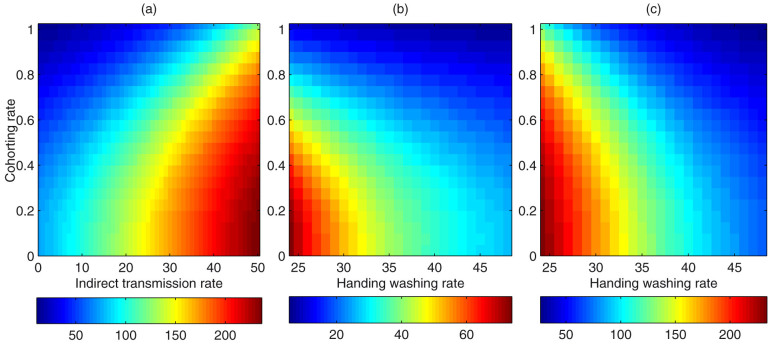
Figure 4.
(a) The average number of colonized patients over a period of 500 days versus indirect transmission rate and cohorting rate simulated by the pairwise model. (b) ((c))The average number of colonized patients over a period of 500 days versus handwashing rate and cohorting rate when the indirect transmission rate was zero (b) or 48.9 (c) simulated by the pairwise model. All other parameter values are as listed in Table 1.

