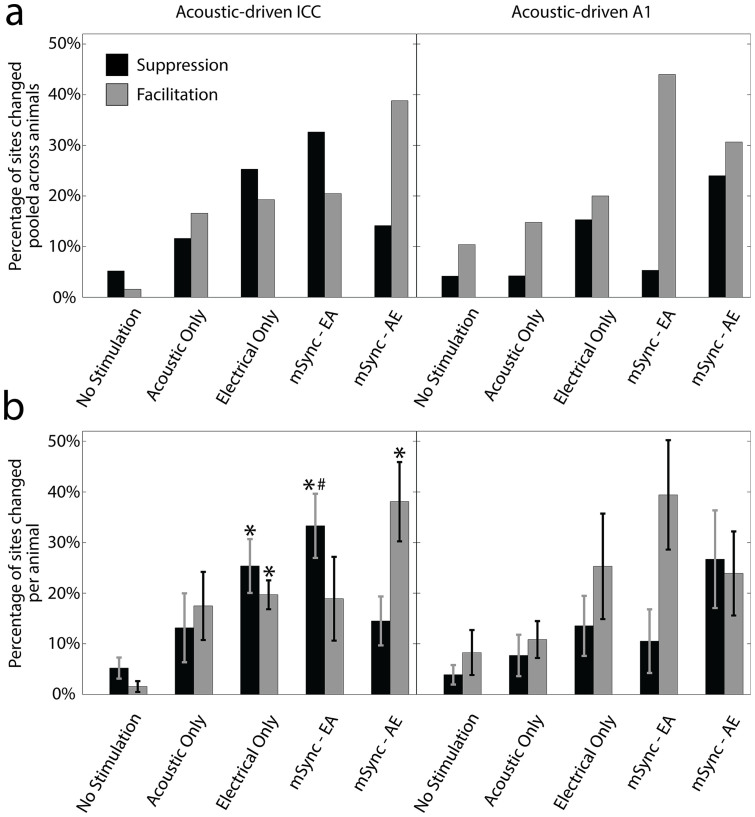
Figure 4. Suppression and facilitation of acoustic-driven responses in ICC and A1 for different stimulation paradigms in Experiment 1.
The data from Figure 3 are separated into suppression (black bars) and facilitation (gray bars) in terms of total percentages pooled across animals (a) and average percentages across animals (b). The n and m values, average site numbers and standard deviations, and statistical analyses are the same as in Figure 3. Asterisks (*) indicate percentages that are significantly different than the No Stimulation paradigm and the pound (#) symbol signifies the one that is significantly different than the Acoustic Only paradigm.

