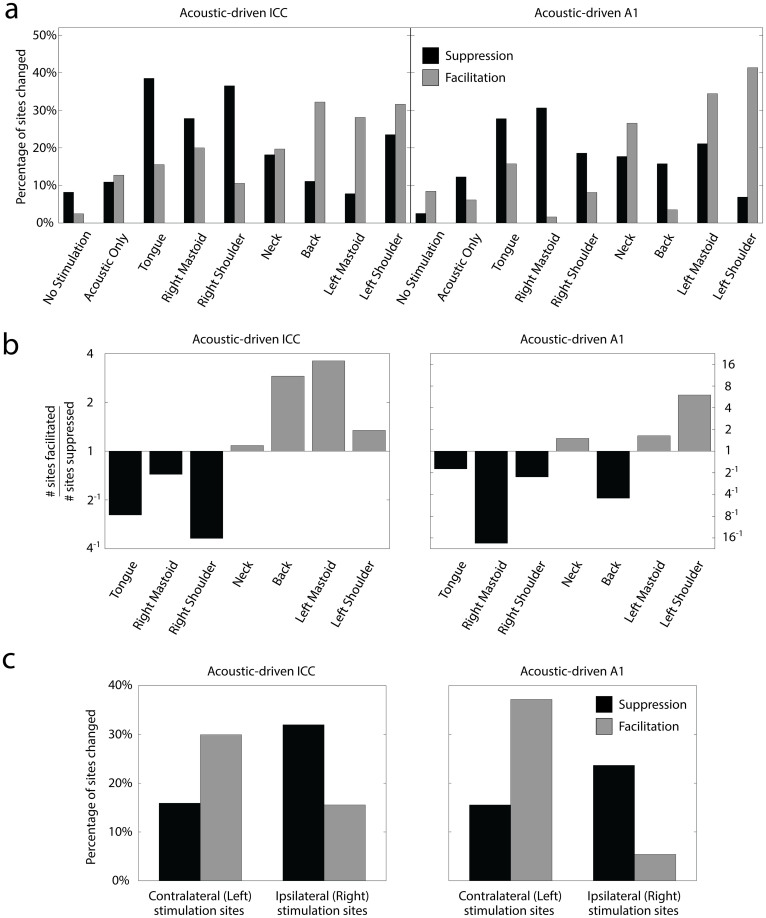
Figure 7. Suppression and facilitation of acoustic-driven responses in ICC and A1 for different stimulation paradigms in Experiment 2.
(a) The total percentages pooled across animals from Figure 6 are separated into suppression (black bars) and facilitation (gray bars). The n and m values and average site numbers and standard deviations are the same as in Figure 6. (b) The experimental data from (a) is replotted as the number of sites significantly facilitated divided by the number of sites significantly suppressed for each body location. Bars in black are predominantly suppressive and bars in gray are predominantly facilitatory. (c) Sites in the ICC or A1 from (a) were pooled together according to the side of the body (shoulders and mastoids) stimulated with mSync for those sites. The percentage of sites that were significantly suppressed (or facilitated) by mSync with a left body site is shown in black (or gray) on the left half of each plot labeled as “Contralateral (Left) stimulation sites”. The percentage of total sites that were suppressed (or facilitated) by mSync with a right body site is shown in black (or gray) on the right half of each plot labeled as “Ipsilateral (Right) stimulation sites”. Site totals (n) were derived by assuming independence across animals (labeled m below) and stimulation protocols. ICC: Left (n = 264, m = 6), Right (n = 219, m = 6); A1: Left (n = 148, m = 4), Right (n = 148, m = 4).

