

Abstract
Purpose
We investigated if associations of breast density and breast cancer differ according to the level of other known breast cancer risk factors, including body mass index (BMI), age at menarche, parity, age at first child’s birth, age at menopause, alcohol consumption, a family history of breast cancer, a history of benign breast disease, and physical activity.
Methods
This study included 1,044 postmenopausal incident breast cancer cases diagnosed within the Nurses’ Health Study cohort and 1,794 matched controls. Percent breast density, absolute dense and non-dense areas were measured from digitized film images with computerized techniques. Information on breast cancer risk factors was obtained prospectively from biennial questionnaires.
Results
Percent breast density was more strongly associated with breast cancer risk in current postmenopausal hormone users (≥50% vs.10%: OR=5.34, 95% CI: 3.36–8.49) as compared to women with past (OR=2.69, 95% CI: 1.32–5.49) or no hormone history (OR=2.57, 95% CI: 1.18–5.60, p-interaction=0.03). Non-dense area was inversely associated with breast cancer risk in parous women, but not in women without children (p-interaction=0.03). Associations of density with breast cancer risk did not differ by the levels of BMI, age at menarche, parity, age at first child’s birth, age at menopause, alcohol consumption, a family history of breast cancer, a history of benign breast disease, and physical activity.
Conclusions
: Women with dense breasts, who currently use menopausal hormone therapy are at a particularly high risk of breast cancer. Most breast cancer risk factors do not modify the association between mammographic breast density and breast cancer risk.
Keywords: breast density, breast cancer risk, risk factors, parity, menopausal hormone use, interactions
Introduction
Mammographic breast density is a well-established and strong predictor of breast cancer risk [1–4]. Appearance of the breast on the mammogram is a reflection of the amount of fat, connective tissue, and epithelial tissue in the breast [3]. Light (non-radiolucent) areas on the mammogram represent the fibrous and glandular tissues (“mammographically dense”), whereas, the dark (radiolucent) areas are primarily fat. Women with breasts of 75% or greater percent density (proportion of the total breast area that appears dense on the mammogram) are at 4- to 6-fold greater risk of breast cancer compared to women with more fat tissues in the breasts [3, 5, 6]. Absolute dense area of the breast that represents fibroglandular tissue has been shown to be positively associated with breast cancer risk in both pre- and postmenopausal women [7–13], while findings for the association between non-dense area of the breast (representing adipose tissue) and breast cancer risk have been conflicting [7, 9, 14, 15].
The evidence on how other breast cancer risk factors modify the association between breast density and breast cancer risk is limited. Significant interactions of percent breast density with Body Mass Index (BMI), use of oral contraceptives, and parity have been previously reported [16–18]. Association of percent mammographic density with breast cancer risk was stronger among women who never used OCs as compared to OC users and was stronger in women with BMI ≥26.7 as compared to those with lower BMI [16]. In parous women, the reduction in risk with greater parity was seen only in women with dense breasts as compared to women with lower density [17]. Another study reported 7.1 fold increase in breast cancer risk in nulliparous women with percent density 5% and greater as compared to parous women with <5% density [19]. In a study by Martin et al., the association of percent density with the risk of breast cancer appeared four times stronger in women with a family history and denser breasts (≥50%) as compared to women without a family history and low density (<10%) [20]. In our recent analysis of associations between percent breast density and breast cancer by menopausal status, hormone use and a family history of breast cancer, the magnitude of the association between percent density and breast cancer risk appeared to be stronger in premenopausal women and postmenopausal women currently using hormones as compared to postmenopausal women with past/never hormone use [21]. Interactions of absolute dense and non-dense areas with breast cancer risk factors have never been investigated.
Identification of risk factors that modify the association between breast density measures and breast cancer risk would allow for better risk prediction, and potentially identification of women at very high-risk of breast cancer. Additionally, if such interactions are found between breast density and modifiable risk factors, such as alcohol and hormone use, specific targeted messages could be recommended for women with denser breasts. In the current study, we assess potential interactions of density measures with a wide range of established breast cancer risk factors (Body Mass Index, menopausal hormone therapy, age at menarche, age at menopause, parity/age at first child’s birth, alcohol consumption, a family history of breast cancer, a personal history of benign breast disease, and physical activity) using prospective data in postmenopausal women from the Nurses’ Health Study.
Participants and Methods
Participants for this nested case-control study were selected from the Nurses’ Health Study (NHS) prospective cohort, which followed registered nurses in the United States who were 30–55 years old at enrollment. After administration of the initial questionnaire, the information on breast cancer risk factors (BMI, reproductive history, postmenopausal hormone [PMH] use, and alcohol use) and any diagnoses of cancer or other diseases was updated through biennial questionnaires [3, 22]. Breast cancer cases were confirmed through medical record review. A nested case-control approach was originally used as an efficient design to examine the association between endogenous hormones, breast density, and breast cancer risk within the NHS cohort [3]. Using incidence density sampling, women who did not have any type of cancer (other than non-melanoma skin cancer) at the time of the case’s cancer diagnosis (controls) were matched 1:1 or 1:2 with women diagnosed with in situ or invasive breast cancer (cases) on age at the time of blood collection, menopausal status and postmenopausal hormone use (current vs. not current) at blood draw, and day/time of blood draw. We made use of this study to examine the interactions between known breast cancer risk factors and breast density. The reference date was defined as the date of diagnosis for cases and their matched controls.
We obtained useable film mammograms closest to the time of blood collection from 1,304 breast cancer cases diagnosed between June 1, 1989, and June 30, 2004 and 2,362 matched controls. Of the 3,666 women, 2,838 cases and controls combined (77%) were postmenopausal at the time of both the mammogram and the reference date. A total of 312 (9 %) women were premenopausal at both dates, and 515 (14%) women were premenopausal at the time of the mammogram and became postmenopausal before the reference date; the menopausal status at the time of the mammogram was unknown for 1 woman. Given this distribution, and results from previous studies suggesting possible differences in the association of breast density with pre- and postmenopausal breast cancer [23, 24], we restricted our analysis to women who were postmenopausal at the time of both the mammogram and reference date (1,044 cases and 1,794 controls). Such restriction also controls for potential density changes from the mammogram date to the reference date as a result of menopausal transition [2, 25]. This study was approved by the Institutional Review Board at the Brigham and Women's Hospital.
Mammographic Breast Density Assessment
To quantify mammographic density, the craniocaudal views of both breasts were digitized at 261 µm per pixel with a Lumisys 85 laser film scanner (Lumisys, Sunnyvale, California). The Cumulus software (University of Toronto, Toronto, Canada) was used for computer-assisted determination of the absolute dense area, non-dense area, and percent mammographic density [3, 26]. During this assessment, the observer was blinded with respect to participant’s case-control status. As reported previously, the measure of mammographic breast density was highly reproducible (within person intra-class correlation coefficient was 0.93) [3]. The average percent density of both breasts was used in this analysis. The mean time between the mammogram date and the date of breast cancer diagnosis was 4.8 years (interquartile range 2–7 years). The mean time between mammogram and the reference date of controls was 4.2 years (interquartile range 1–7 years).
Covariate Information
Information on breast cancer risk factors was obtained from the biennial questionnaires before the date of the breast cancer diagnosis (reference date) for cases and their matched controls. Women were considered postmenopausal if they reported (1) no menstrual periods within the 12 months prior to diagnosis date, if natural menopause, (2) having had bilateral oophorectomy, or hysterectomy with retention of at least one ovary, or (3) being 54 or 56 years or older if a smoker or nonsmoker, respectively.
Statistical Analysis
The differences in distribution of the breast cancer risk factors in cases and controls were tested with Wilcoxon–Mann–Whitney test for breast density, two-sample t test if the variable was continuous and using χ2 test if the variable was categorical. We used unconditional logistic regression adjusted for matching factors to describe the association between breast density measures and breast cancer risk. The risk estimates were presented as odds ratios (ORs) and their corresponding 95% Confidence Intervals (95% CIs). In the logistic regression analysis, we modeled percent breast density as <10%, 10–24%, 25–49%, and ≥50% [21, 27]. We defined quartiles of absolute dense and non-dense area using the distribution of these density measures among controls (total absolute dense area: 1st: <17 cm2; 2nd: 17–<32 cm2; 3rd: 32–<55 cm2; 4th : ≥55 cm2; non-dense area: 1st: <80 cm2; 2nd: 80–<133 cm2; 3rd: 133–<203 cm2; 4th: ≥203 cm2). Variables that showed significant association with either breast cancer or breast density in previous studies, including those from NHS, were considered as potential confounders and included in adjusted logistic regression models. We included the following matching variables and potential confounders : age at diagnosis (continuous, years), body mass index (continuous, kg/m2), age at menarche (<12, 12–13, or >13 years), parity and age at first birth (i.e., age at the end of the first pregnancy lasting ≥6 months, modeled as nulliparous, any number of children with age at birth<25 years, any number of children with age at birth ≥25 years), menopausal hormone therapy (never used hormones, past hormone use, current hormone use), age at menopause (50, 50–<55, ≥55 years), a family history of breast cancer (yes or no), a biopsy-confirmed history of benign breast disease (yes vs. no), alcohol consumption (0, <5, or ≥5 g/day), and smoking status (ever vs. never). Association of density with breast cancer by the level of physical activity was examined in strata defined according to the physical activity quartiles (<4.4, 4.4–<12, 12–<25.5, and ≥25.5 mets/week). Association of density with the risk of breast cancer by BMI was examined in women with BMI <25, 25–<30, and ≥30 kg/m2.
Differences in the associations of breast density with breast cancer risk by the level of known risk factors was tested with two-way interactions and using Wald Chi-square test. For variables that were continuous in nature (alcohol consumption, age at menarche, age at menopause, BMI, physical activity, and density measures), we used respective medians within each of the categories for these variables to model the interaction. To test interactions of menopausal hormone therapy with density measures, we modeled hormone use as an ordinal variable. Next, we created a combined variable representing joint effects of menopausal hormone therapy and density. To test interactions of parity and age at first child’s birth with density, we first investigated the interaction of nulliparity (binary) with density. In a secondary analysis restricted to parous women only, we investigated separately interactions of parity and age at first child’s birth with density, all modeled as continuous variables. Finally, we examined the interaction of a birth index (combination of total parity, ages at each birth, and time since last birth) with density measures modeling these variables as continuous [28]. Statistical significance in all the analyses was assessed at 0.05 level. The analyses were performed using SAS software (version 9.2, SAS Institute, Cary, NC, USA).
Results
In this nested case-control study of 1,044 breast cancer cases and 1,794 matched controls, cases had a higher median percent breast density (27.8 vs. 20.5%, p <0.001), higher median absolute dense area (43.1 vs. 32.2 cm2, p <0.001), and lower median area of non-dense breast tissue (116.8 vs. 132.6 cm2, p <0.001) compared with controls. Characteristics of this study population have been previously described [27]. In summary, cases were more likely to be current postmenopausal hormone users (56.7% vs. 46.3%, p <0.001), were more likely to have a family history of breast cancer (19.5% vs.14.5%, p <0.001), and were more likely to have a biopsy-confirmed history of benign breast disease (33.4% vs. 25.8%, p <0.001). Cases and controls did not significantly differ with respect to other covariates.
In the multivariable analysis, higher percent density was associated with breast cancer risk increase (≥50% vs. <10%, odds ratio [OR] =3.36, 95% confidence interval [CI] 2.44–4.63, p-trend<0.0001). Larger absolute dense area was associated with an increase in breast cancer risk (4th vs. 1st quartile, OR=1.96, 95% CI 1.55–2.48, p-trend<0.0001), while larger non-dense area was associated with breast cancer risk decrease (4th vs. 1st quartile, OR=0.51, 95% CI 0.39–0.66, p-trend<0·0001) (Supplementary table S1).
We evaluated the association of postmenopausal breast density with breast cancer risk while stratifying women by the level of the established breast cancer risk factor. Percent breast density was more strongly associated with the risk of breast cancer in postmenopausal women currently taking hormones as compared to women with past hormone use or women with no history of postmenopausal hormone use as we have seen before (percent density≥50% vs. 10%: OR=5.34 [95% CI: 3.36–8.49] for current users, OR=2.69 [95% CI: 1.32–5.49] for past users, OR=2.57 [95% CI: 1.18–5.60] for never users], p for interaction=0.03) (Table 1) [21]. When we considered percent breast density and postmenopausal hormone use jointly in the analysis, the risk was 4.30 (95% CI: 2.79–6.65) times greater in women with current hormone use and dense breasts (≥50%) as compared to women with low density and no history of hormone use (Figure 1).
Table 1.
Association of percent breast density with breast cancer, by the level of breast cancer risk factor a.
| Breast cancer risk factor | Percent density categories |
p for trend |
P for interaction |
|||||||
|---|---|---|---|---|---|---|---|---|---|---|
| <10% (reference) |
10–24% | 25–49% | ≥50% | |||||||
| N Cases/ Controls |
OR | N Cases/ Controls |
OR (95% CI) |
N Cases/ Controls |
OR (95% CI) |
N Cases/ Controls |
OR (95% CI) |
|||
| Alcohol consumption, g/day | ||||||||||
| 0 | 76/175 | 1.00 | 125/227 | 1.33 (0.93–1.91) | 146/186 | 2.24 (1.52–3.30) | 45/52 | 2.54 (1.47–4.38) | <0.0001 | 0.64 |
| >0-<5 | 41/145 | 1.00 | 84/221 | 1.41 (0.89–2.22) | 98/179 | 2.13 (1.32–3.41) | 68/38 | 7.03 (3.89–12.71) | <0.0001 | |
| ≥5 | 32/99 | 1.00 | 85/178 | 1.39 (0.84–2.31) | 149/165 | 2.62 (1.56–4.39) | 54/65 | 2.25 (1.20–4.22) | <0.01 | |
| History of benign breast disease | ||||||||||
| No | 125/348 | 1.00 | 218/492 | 1.35 (1.03–1.78) | 263/384 | 2.39 (1.79–3.20) | 89/105 | 3.07 (2.07–4.54) | <0.0001 | 0.12 |
| Yes | 30/86 | 1.00 | 85/156 | 1.34 (0.80–2.25) | 152/165 | 2.36 (1.42–3.92) | 82/55 | 3.70 (2.04–6.69) | <0.0001 | |
| Family history of breast cancer | ||||||||||
| No | 127/377 | 1.00 | 237/553 | 1.32 (1.02–1.72) | 341/467 | 2.36 (1.80–3.10) | 135/135 | 3.34 (2.36–4.74) | <0.0001 | |
| Yes | 28/57 | 1.00 | 66/95 | 1.50 (0.83–2.70) | 74/82 | 2.33 (1.25–4.35) | 36/25 | 3.42 (1.52–7.66) | <0.01 | 0.56 |
| Postmenopausal hormone use (PMH) | ||||||||||
| None | 59/152 | 1.00 | 68/187 | 1.04 (0.68–1.61) | 67/118 | 1.99 (1.23–3.22) | 18/24 | 2.57 (1.18–5.60) | <0.01 | 0.03 |
| Past | 39/106 | 1.00 | 67/154 | 1.30 (0.79–2.14) | 64/128 | 1.69 (0.98–2.91) | 30/36 | 2.69 (1.32–5.49) | <0.01 | |
| Current | 47/165 | 1.00 | 151/282 | 1.96 (1.32–2.91) | 275/289 | 3.75 (2.54–5.55) | 119/94 | 5.34 (3.36–8.49) | <0.0001 | |
| Age at menarche, yrs | ||||||||||
| <12 | 45/107 | 1.00 | 59/161 | 0.92 (0.57–1.50) | 98/105 | 2.82 (1.69–4.68) | 39/22 | 5.44 (2.68–11.03) | <0.0001 | |
| 12–13 | 83/235 | 1.00 | 185/358 | 1.49 (1.08–2.06) | 237/326 | 2.20 (1.58–3.07) | 96/98 | 2.85 (1.87–4.36) | <0.0001 | 0.05 |
| >13 | 27/92 | 1.00 | 59/129 | 1.84 (1.06–3.22) | 80/118 | 3.03 (1.70–5.42) | 36/40 | 4.02 (1.97–8.19) | <0.0001 | |
| Nulliparityb | ||||||||||
| Nulliparous | 9/18 | 1.00 | 26/27 | 2.99 (0.94–9.57) | 29/38 | 1.99 (0.61–6.51) | 19/20 | 2.30 (0.61–8.73) | 0.74 | 0.12 |
| Parous | 146/416 | 1.00 | 277/621 | 1.33 (1.04–1.70) | 386/511 | 2.45 (1.90–3.16) | 152/140 | 3.67 (2.63–5.11) | <0.0001 | |
| Parityc | ||||||||||
| 1 | 7/19 | 1.00 | 9/30 | 0.83 (0.19–3.63) | 34/37 | 4.58 (1.26–16.61) | 21/10 | 10.85 (2.35–50.20) | <0.0001 | 0.15 |
| 2 | 31/92 | 1.00 | 67/147 | 1.35 (0.80–2.29) | 90/136 | 2.02 (1.19–3.45) | 57/49 | 4.12 (2.16–7.86) | <0.0001 | |
| ≥3 | 104/301 | 1.00 | 198/439 | 1.37 (1.02–1.83) | 255/337 | 2.51 (1.84–3.41) | 71/80 | 2.96 (1.93–4.53) | <0.0001 | |
| Age at 1st child’s birth, yrsd | <0.0001 | 0.21 | ||||||||
| ≤25 | 73/218 | 1.00 | 119/324 | 1.14 (0.80–1.62) | 199/263 | 2.50 (1.75–3.58) | 71/62 | 4.09 (2.52–6.63) | <0.0001 | |
| >25 | 69/194 | 1.00 | 155/292 | 1.60 (1.12–2.28) | 180/247 | 2.42 (1.66–3.53) | 78/77 | 3.31 (2.06–5.32) | ||
| Body Mass Index, kg/m2 | ||||||||||
| <25 | 23/91 | 1.00 | 102/279 | 1.38 (0.82–2.31) | 236/343 | 2.48 (1.51–4.07) | 115/117 | 3.31 (1.91–5.73) | <0.0001 | 0.92 |
| 25-<30 | 60/163 | 1.00 | 123/246 | 1.32 (0.91–1.93) | 135/152 | 2.39 (1.61–3.56) | 44/33 | 3.50 (1.99–6.18) | <0.0001 | |
| ≥30 | 72/180 | 1.00 | 78/123 | 1.50 (0.99–2.26) | 44/54 | 2.10 (1.26–3.52) | 12/10 | 3.29 (1.30–8.37) | <0.001 | |
| Physical activity (mets/week) | ||||||||||
| <4.4 | 45/128 | 1.00 | 80/184 | 1.26 (0.80–1.99) | 109/120 | 2.84 (1.74–4.62) | 35/38 | 2.65 (1.37–5.15) | <0.0001 | 0.09 |
| 4.4-<12 | 38/106 | 1.00 | 87/150 | 1.59 (0.98–2.60) | 101/134 | 2.23 (1.33–3.74) | 52/30 | 5.05 (2.58–9.89) | <0.0001 | |
| 12-<25.5 | 30/109 | 1.00 | 70/150 | 1.88 (1.11–3.18) | 106/149 | 3.32 (1.95–5.66) | 40/41 | 4.82 (2.47–9.38) | <0.0001 | |
| ≥ 25.5 | 42/91 | 1.00 | 66/164 | 0.95 (0.58–1.54) | 99/146 | 1.70 (1.02–2.83) | 44/51 | 2.16 (1.15–4.05) | <0.01 | |
| Age at menopause, yrs | ||||||||||
| <50 | 40/133 | 1.00 | 105/190 | 1.84 (1.17–2.88) | 140/188 | 2.61 (1.65–4.12) | 43/50 | 2.76 (1.52–5.02) | <0.001 | 0.38 |
| 50-<55 | 106/274 | 1.00 | 175/409 | 1.16 (0.86–1.57) | 240/321 | 2.23 (1.62–3.05) | 108/90 | 3.83 (2.55–5.75) | <0.0001 | |
| ≥55 | 9/25 | 1.00 | 20/46 | 1.88 (0.59–5.96) | 28/29 | 4.12 (1.23–13.77) | 11/9 | 4.33 (0.97–19.43) | 0.02 | |
Multivariate models in stratified analyses are adjusted for the following covariates (with the exception of the covariate used for stratification) : age at diagnosis (continuous, years), body mass index (continuous, kg/m2), age at menarche (<12, 12–13, or >13 years), parity and age at first birth (i.e., age at the end of the first pregnancy lasting ≥6 months, modeled as nulliparous, any number of children with age at birth<25 years, any number of children with age at birth ≥25 years), menopausal hormone therapy (never used hormones, current hormone use, past hormone use), age at menopause (50, 50–<55, ≥55 years), a family history of breast cancer (yes or no), a biopsy-confirmed history of benign breast disease (yes vs. no), alcohol consumption (0, <5, or ≥5 g/day), and smoking status (ever vs. never)
Multivariate models in stratified analyses are adjusted for the following covariates: age at diagnosis (continuous, years), body mass index (continuous, kg/m2), age at menarche (<12, 12–13, or >13 years), age at first birth (among parous only, continuous), menopausal hormone therapy (never used hormones, current hormone use, past hormone use), age at menopause (50, 50–<55, ≥55 years), a family history of breast cancer (yes or no), a biopsy-confirmed history of benign breast disease (yes vs. no), alcohol consumption (0, <5, or ≥5 g/day), and smoking status (ever vs. never)
Among parous women only; multivariate models in stratified analyses are adjusted for age at diagnosis (continuous, years), body mass index (continuous, kg/m2), age at menarche (<12, 12–13, or >13 years), age at first birth (continuous), menopausal hormone therapy (never used hormones, current hormone use, past hormone use), age at menopause (50, 50–<55, ≥55 years), a family history of breast cancer (yes or no), a biopsy-confirmed history of benign breast disease (yes vs. no), alcohol consumption (0, <5, or ≥5 g/day), and smoking status (ever vs. never)
Among parous women only; multivariate models in stratified analyses are adjusted for age at diagnosis (continuous, years), body mass index (continuous, kg/m2), age at menarche (<12, 12–13, or >13 years), parity (continuous), menopausal hormone therapy (never used hormones, current hormone use, past hormone use), age at menopause (50, 50–<55, ≥55 years), a family history of breast cancer (yes or no), a biopsy-confirmed history of benign breast disease (yes vs. no), alcohol consumption (0, <5, or ≥5 g/day), and smoking status (ever vs. never)
Fig. 1.
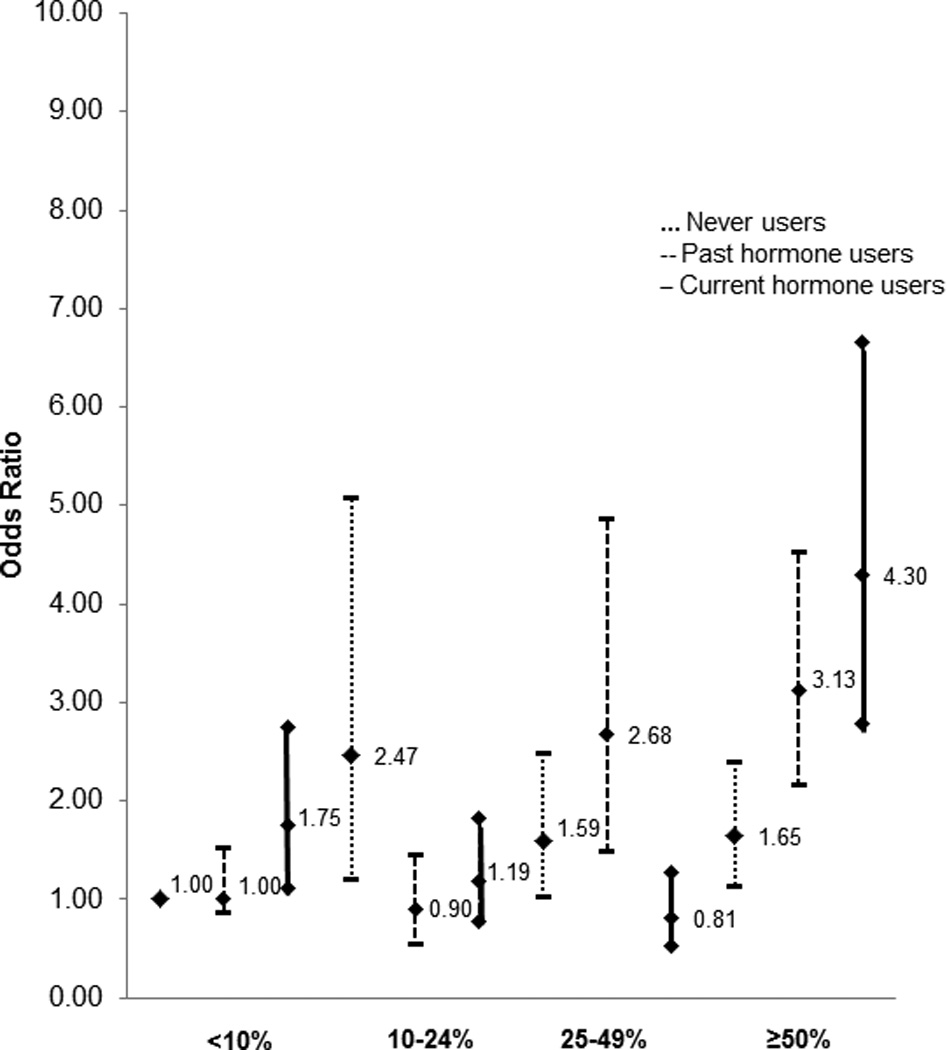
Odds ratios and 95% confidence intervals for the joint effects of percent density and postmen opausal hormone use on breast cancer risk
Absolute non-dense area was more strongly inversely associated with the risk of breast cancer in postmenopausal women currently taking hormones as compared to women with past hormone use or women with no history of postmenopausal hormone use (4th vs. 1st quartiles: OR=0.42 [95% CI: 0.30–0.61] for current users, OR=0.50 [95% CI: 0.28–0.92] for past users, OR=0.72 [95% CI: 0.41–1.29] for never users, p for interaction=0.04) (Supplementary table S2). The association of absolute dense area with breast cancer appeared to be stronger in postmenopausal women currently using hormones, but the interaction did not reach statistical significance (p for interaction=0.10) (Supplementary table S3).
We found no differences in the association of percent density with breast cancer risk when we compared nulliparous women to parous women (p-interaction=0.12) (Table 1). Additionally, we found no differences in the association of percent density with breast cancer risk when we restricted to parous women and examined interactions of percent breast density with age at first birth (p-interaction=0.21) and parity (p-interaction=0.15) (Table 1). Non-dense area was inversely associated with breast cancer risk in parous women, but not in nulliparous women (p-interaction=0.03) (Supplementary table S2). Among parous women, non-dense area was not associated with either number of children or age at first child’s birth (Supplementary table S2). The associations of absolute dense area with breast cancer risk did not differ by nulliparity and did not differ by parity and age at first child’s birth among parous women (Supplementary table S3). Interactions of percent breast density, absolute dense and non-dense area with birth index were not significant (p for interaction=0.50, 0.16, and 0.91, respectively).
We found a suggestive interaction of percent breast density with age at menarche, but there was no consistent trend across the levels of age at menarche (percent density≥50% vs. 10%: OR=5.44 [95% CI: 2.68–11.03] for menarche at age <12, OR=2.85 [95% CI: 1.87–4.36] for menarche at age 12–13, and OR=4.02 [95% CI: 1.97–8.19] for menarche at age >13, p for interaction=0.05) (Table 1). Associations of density measures with breast cancer risk did not differ by the levels of BMI, age at menopause, alcohol consumption, a family history of breast cancer, a personal history of benign breast disease, and physical activity.
Discussion
In this nested case-control study with 1,044 breast cancer cases and 1,794 matched controls, we found no differences in the association of postmenopausal breast density measures with breast cancer risk by a family history of breast cancer, a history of benign breast disease, alcohol use, BMI, physical activity, and age at menopause. However, the association of percent breast density and non-dense area with breast cancer risk differed according to menopausal hormone use and associations of non-dense area differed by nulliparity status. The magnitude of the association of percent breast density and non-dense area with breast cancer risk was strongest in postmenopausal women currently taking hormones. The association of non-dense area was stronger in parous women.
Our results examining the association of breast density and breast cancer according to postmenopausal hormone use status are consistent with previous reports [21, 24]. Recent work by Kerlikowske et al. reported significant differences in the association between breast density and breast cancer risk according to menopausal status/hormone use among 14,090 cases and 573,279 controls [24]. Studies of the effects of hormone therapy on breast density consistently show an increase in breast density among postmenopausal women on hormone therapy [29–32]. However, this hormone therapy-driven increase in breast density does not entirely explain the increase in breast cancer risk [33]. The joint effect of menopausal hormone therapy and high breast density on breast cancer risk could result from stimulation of a larger number of epithelial and stromal cells in denser breasts by hormones [3, 34] and, thus, higher potential for mutation and, subsequently, a greater breast cancer risk. This mechanism is consistent with results from our prior study which showed that women with high circulating hormone levels and high density were at the highest risk of breast cancer [3]. The role of adipose tissue in breast carcinogenesis is poorly understood. It has been previously suggested that the local estrogen conversion and production of cancer-promoting adipokines in the breast adipose tissue could increase breast cancer risk, which could result in a greater rather than decreased risk of breast cancer in women with larger amounts of adipose tissue [35]. According to another hypothesis, dense area might be reflective of postmenopausal lobular involution in the breast tissue that has been inversely associated with breast cancer risk in previous studies [25, 36, 37].
We found a significant interaction of non-dense area with breast cancer risk by nulliparity status, but did not find differences in the associations by parity or age at first child’s birth among parous women. Similarly, we did not find differences in the association of percent breast density and absolute dense area with breast cancer by either nulliparity or by parity and age at first child’s among parous women. Previous studies reported a stronger association of percent density with breast cancer risk in parous women [17, 19], but the differences in the association of non-dense area have never been investigated. Parity and younger age at first child’s birth have shown a protective effect on breast cancer risk in previous studies [38–40]. It was suggested that parity reduces the area of dense breast tissue and increases the area of non-dense tissue [41]. Our findings suggest that parous women with larger area of non-dense tissue were at a decreased risk of breast cancer as compared to nulliparous women. However, the number of nulliparous women in our study was small (n=83) and these finding should be interpreted with caution.
We explore, for the first time, interactions of a wide range of breast cancer risk factors with breast density measures in a large study from an established prospective cohort. Our study has a few limitations. The current analysis was restricted to women who were postmenopausal at the time of both mammogram and diagnosis, which constitutes the majority of the population assembled for the nested case–control study (77%). Our findings are thus limited to postmenopausal women and do not necessarily apply to premenopausal breast density or breast cancer. In addition, relatively small numbers of women in some of the strata might have resulted in chance findings that should be interpreted with caution.
In conclusion, we investigated the interactions of percent breast density, absolute dense and non-dense areas with breast cancer risk factors. Our findings suggest that percent breast density may have a stronger association with breast cancer risk among postmenopausal women currently using postmenopausal hormones and non-dense area may have a stronger association in parous women. These finding warrant further investigation for a better understanding of underlying biological mechanisms driving these association patterns.
Supplementary Material
Acknowledgements
We would like to thank the participants and staff of the Nurses’ Health Study for their valuable contributions as well as the following state cancer registries for their help: AL, AZ, AR, CA, CO, CT, DE, FL, GA, ID, IL, IN, IA, KY, LA, ME, MD, MA, MI, NE, NH, NJ, NY, NC, ND, OH, OK, OR, PA, RI, SC, TN, TX, VA, WA, WY. The authors assume full responsibility for analyses and interpretation of these data.
Grant support
Financial support was received from Public Health Service Grants CA131332, CA186107, CA087969, CA186107, UM1 from the National Cancer Institute, National Institutes of Health, Department of Health and Human Services, Avon Foundation for Women, Susan G. Komen for the Cure®, and Breast Cancer Research Foundation. Dr. Colditz is supported in part by an American Cancer Society Cissy Hornung Clinical Research Professorship.
Footnotes
Conflicts of Interest
The authors declare that they have no conflict of interest.
References
- 1.Boyd NF, Rommens JM, Vogt K, Lee V, Hopper JL, Yaffe MJ, Paterson AD. Mammographic breast density as an intermediate phenotype for breast cancer. Lancet Oncol. 2005;6(10):798–808. doi: 10.1016/S1470-2045(05)70390-9. [DOI] [PubMed] [Google Scholar]
- 2.Ginsburg OM, Martin LJ, Boyd NF. Mammographic density, lobular involution, and risk of breast cancer. Br J Cancer. 2008;99(9):1369–1374. doi: 10.1038/sj.bjc.6604635. [DOI] [PMC free article] [PubMed] [Google Scholar]
- 3.Tamimi RM, Byrne C, Colditz GA, Hankinson SE. Endogenous hormone levels, mammographic density, and subsequent risk of breast cancer in postmenopausal women. J Natl Cancer Inst. 2007;99(15):1178–1187. doi: 10.1093/jnci/djm062. [DOI] [PubMed] [Google Scholar]
- 4.Harvey JA, Bovbjerg VE. Quantitative assessment of mammographic breast density: relationship with breast cancer risk. Radiology. 2004;230(1):29–41. doi: 10.1148/radiol.2301020870. [DOI] [PubMed] [Google Scholar]
- 5.Boyd NF, Byng JW, Jong RA, Fishell EK, Little LE, Miller AB, Lockwood GA, Tritchler DL, Yaffe MJ. Quantitative classification of mammographic densities and breast cancer risk: results from the Canadian National Breast Screening Study. J Natl Cancer Inst. 1995;87(9):670–675. doi: 10.1093/jnci/87.9.670. [DOI] [PubMed] [Google Scholar]
- 6.Byrne C, Schairer C, Wolfe J, Parekh N, Salane M, Brinton LA, Hoover R, Haile R. Mammographic features and breast cancer risk: effects with time, age, and menopause status. J Natl Cancer Inst. 1995;87(21):1622–1629. doi: 10.1093/jnci/87.21.1622. [DOI] [PubMed] [Google Scholar]
- 7.Pettersson A, Hankinson S, Willett W, Lagiou P, Trichopoulos D, Tamimi R. Nondense mammographic area and risk of breast cancer. Breast Cancer Research. 2011;13(5):R100. doi: 10.1186/bcr3041. [DOI] [PMC free article] [PubMed] [Google Scholar]
- 8.Aitken Z, McCormack VA, Highnam RP, Martin L, Gunasekara A, Melnichouk O, Mawdsley G, Peressotti C, Yaffe M, Boyd NF, dos Santos Silva I. Screen-Film Mammographic Density and Breast Cancer Risk: A Comparison of the Volumetric Standard Mammogram Form and the Interactive Threshold Measurement Methods. Cancer Epidemiology Biomarkers & Prevention. 2010;19(2):418–428. doi: 10.1158/1055-9965.EPI-09-1059. [DOI] [PMC free article] [PubMed] [Google Scholar]
- 9.Stone J, Ding J, Warren RM, Duffy SW, Hopper JL. Using mammographic density to predict breast cancer risk: dense area or percentage dense area. Breast Cancer Res. 2010;12(6):R97. doi: 10.1186/bcr2778. [DOI] [PMC free article] [PubMed] [Google Scholar]
- 10.Ursin G, Ma H, Wu AH, Bernstein L, Salane M, Parisky YR, Astrahan M, Siozon CC, Pike MC. Mammographic Density and Breast Cancer in Three Ethnic Groups. Cancer Epidemiology Biomarkers & Prevention. 2003;12(4):332–338. [PubMed] [Google Scholar]
- 11.Maskarinec G, Pagano I, Lurie G, Wilkens LR, Kolonel LN. Mammographic Density and Breast Cancer Risk. American Journal of Epidemiology. 2005;162(8):743–752. doi: 10.1093/aje/kwi270. [DOI] [PubMed] [Google Scholar]
- 12.Boyd N, Martin L, Gunasekara A, Melnichouk O, Maudsley G, Peressotti C, Yaffe M, Minkin S. Mammographic Density and Breast Cancer Risk: Evaluation of a Novel Method of Measuring Breast Tissue Volumes. Cancer Epidemiology Biomarkers & Prevention. 2009;18(6):1754–1762. doi: 10.1158/1055-9965.EPI-09-0107. [DOI] [PubMed] [Google Scholar]
- 13.Vachon CM, Brandt KR, Ghosh K, Scott CG, Maloney SD, Carston MJ, Pankratz VS, Sellers TA. Mammographic Breast Density as a General Marker of Breast Cancer Risk. Cancer Epidemiology Biomarkers & Prevention. 2007;16(1):43–49. doi: 10.1158/1055-9965.EPI-06-0738. [DOI] [PubMed] [Google Scholar]
- 14.Lokate M, Peeters PH, Peelen LM, Haars G, Veldhuis WB, van Gils CH. Mammographic density and breast cancer risk: the role of the fat surrounding the fibroglandular tissue. Breast Cancer Res. 2011;13(5):R103. doi: 10.1186/bcr3044. [DOI] [PMC free article] [PubMed] [Google Scholar]
- 15.Pettersson A, Graff RE, Ursin G, Santos Silva ID, McCormack V, Baglietto L, Vachon C, Bakker MF, Giles GG, Chia KS, Czene K, Eriksson L, Hall P, Hartman M, Warren RM, Hislop G, Chiarelli AM, Hopper JL, Krishnan K, Li J, Li Q, Pagano I, Rosner BA, Wong CS, Scott C, Stone J, Maskarinec G, Boyd NF, van Gils CH, Tamimi RM. Mammographic Density Phenotypes and Risk of Breast Cancer: A Meta-analysis. J Natl Cancer Inst. 2014 doi: 10.1093/jnci/dju078. [DOI] [PMC free article] [PubMed] [Google Scholar]
- 16.Wong CS, Lim GH, Gao F, Jakes RW, Offman J, Chia KS, Duffy SW. Mammographic density and its interaction with other breast cancer risk factors in an Asian population. Br J Cancer. 2011;104(5):871–874. doi: 10.1038/sj.bjc.6606085. [DOI] [PMC free article] [PubMed] [Google Scholar]
- 17.Duffy SW, Jakes RW, Ng FC, Gao F. Interaction of dense breast patterns with other breast cancer risk factors in a case-control study. Br J Cancer. 2004;91(2):233–236. doi: 10.1038/sj.bjc.6601911. [DOI] [PMC free article] [PubMed] [Google Scholar]
- 18.Woolcott CG, Koga K, Conroy SM, Byrne C, Nagata C, Ursin G, Vachon CM, Yaffe MJ, Pagano I, Maskarinec G. Mammographic density, parity and age at first birth, and risk of breast cancer: an analysis of four case-control studies. Breast Cancer Res Treat. 2012;132(3):1163–1171. doi: 10.1007/s10549-011-1929-9. [DOI] [PMC free article] [PubMed] [Google Scholar]
- 19.van Gils CH, Hendriks JH, Otten JD, Holland R, Verbeek AL. Parity and mammographic breast density in relation to breast cancer risk: indication of interaction. Eur J Cancer Prev. 2000;9(2):105–111. doi: 10.1097/00008469-200004000-00006. [DOI] [PubMed] [Google Scholar]
- 20.Martin LJ, Melnichouk O, Guo H, Chiarelli AM, Hislop TG, Yaffe MJ, Minkin S, Hopper JL, Boyd NF. Family History, Mammographic Density, and Risk of Breast Cancer. Cancer Epidemiology Biomarkers & Prevention. 2010;19(2):456–463. doi: 10.1158/1055-9965.EPI-09-0881. [DOI] [PubMed] [Google Scholar]
- 21.Yaghjyan L, Colditz GA, Rosner B, Tamimi RM. Mammographic breast density and breast cancer risk by menopausal status, postmenopausal hormone use and a family history of breast cancer. Cancer Causes Control. 2012 doi: 10.1007/s10552-012-9936-7. [DOI] [PMC free article] [PubMed] [Google Scholar]
- 22.Colditz GA, Hankinson SE. The Nurses' Health Study: lifestyle and health among women. Nature reviews Cancer. 2005;5(5):388–396. doi: 10.1038/nrc1608. [DOI] [PubMed] [Google Scholar]
- 23.McCormack VA, dos Santos Silva I. Breast density and parenchymal patterns as markers of breast cancer risk: a meta-analysis. Cancer Epidemiol Biomarkers Prev. 2006;15(6):1159–1169. doi: 10.1158/1055-9965.EPI-06-0034. [DOI] [PubMed] [Google Scholar]
- 24.Kerlikowske K, Cook AJ, Buist DS, Cummings SR, Vachon C, Vacek P, Miglioretti DL. Breast cancer risk by breast density, menopause, and postmenopausal hormone therapy use. J Clin Oncol. 2010;28(24):3830–3837. doi: 10.1200/JCO.2009.26.4770. [DOI] [PMC free article] [PubMed] [Google Scholar]
- 25.Ghosh K, Hartmann LC, Reynolds C, Visscher DW, Brandt KR, Vierkant RA, Scott CG, Radisky DC, Sellers TA, Pankratz VS, Vachon CM. Association between mammographic density and age-related lobular involution of the breast. J Clin Oncol. 2010;28(13):2207–2212. doi: 10.1200/JCO.2009.23.4120. [DOI] [PMC free article] [PubMed] [Google Scholar]
- 26.Byng JW, Boyd NF, Little L, Lockwood G, Fishell E, Jong RA, Yaffe MJ. Symmetry of projection in the quantitative analysis of mammographic images. Eur J Cancer Prev. 1996;5(5):319–327. doi: 10.1097/00008469-199610000-00003. [DOI] [PubMed] [Google Scholar]
- 27.Yaghjyan L, Colditz GA, Collins LC, Schnitt SJ, Rosner B, Vachon C, Tamimi RM. Mammographic breast density and subsequent risk of breast cancer in postmenopausal women according to tumor characteristics. J Natl Cancer Inst. 2011;103(15):1179–1189. doi: 10.1093/jnci/djr225. [DOI] [PMC free article] [PubMed] [Google Scholar]
- 28.Rosner B, Colditz GA. Nurses' health study: log-incidence mathematical model of breast cancer incidence. J Natl Cancer Inst. 1996;88(6):359–364. doi: 10.1093/jnci/88.6.359. [DOI] [PubMed] [Google Scholar]
- 29.Conner P, Svane G, Azavedo E, Soderqvist G, Carlstrom K, Graser T, Walter F, von Schoultz B. Mammographic breast density, hormones, and growth factors during continuous combined hormone therapy. Fertil Steril. 2004;81(6):1617–1623. doi: 10.1016/j.fertnstert.2004.02.096. [DOI] [PubMed] [Google Scholar]
- 30.Greendale GA, Palla SL, Ursin G, Laughlin GA, Crandall C, Pike MC, Reboussin BA. The association of endogenous sex steroids and sex steroid binding proteins with mammographic density: results from the Postmenopausal Estrogen/Progestin Interventions Mammographic Density Study. Am J Epidemiol. 2005;162(9):826–834. doi: 10.1093/aje/kwi286. [DOI] [PubMed] [Google Scholar]
- 31.Pettersen PC, Raundahl J, Loog M, Nielsen M, Tanko LB, Christiansen C. Parallel assessment of the impact of different hormone replacement therapies on breast density by radiologist- and computer-based analyses of mammograms. Climacteric. 2008;11(2):135–143. doi: 10.1080/13697130801930385. [DOI] [PubMed] [Google Scholar]
- 32.Vachon CM, Sellers TA, Vierkant RA, Wu FF, Brandt KR. Case-control study of increased mammographic breast density response to hormone replacement therapy. Cancer Epidemiol Biomarkers Prev. 2002;11(11):1382–1388. [PubMed] [Google Scholar]
- 33.Boyd NF, Martin LJ, Li Q, Sun L, Chiarelli AM, Hislop G, Yaffe MJ, Minkin S. Mammographic density as a surrogate marker for the effects of hormone therapy on risk of breast cancer. Cancer Epidemiol Biomarkers Prev. 2006;15(5):961–966. doi: 10.1158/1055-9965.EPI-05-0762. [DOI] [PubMed] [Google Scholar]
- 34.Li T, Sun L, Miller N, Nicklee T, Woo J, Hulse-Smith L, Tsao MS, Khokha R, Martin L, Boyd N. The association of measured breast tissue characteristics with mammographic density and other risk factors for breast cancer. Cancer Epidemiol Biomarkers Prev. 2005;14(2):343–349. doi: 10.1158/1055-9965.EPI-04-0490. [DOI] [PubMed] [Google Scholar]
- 35.van Kruijsdijk RCM, van der Wall E, Visseren FLJ. Obesity and Cancer: The Role of Dysfunctional Adipose Tissue. Cancer Epidemiology Biomarkers & Prevention. 2009;18(10):2569–2578. doi: 10.1158/1055-9965.EPI-09-0372. [DOI] [PubMed] [Google Scholar]
- 36.Pettersson A, Hankinson SE, Willett WC, Lagiou P, Trichopoulos D, Tamimi RM. Nondense mammographic area and risk of breast cancer. Breast Cancer Res. 2011;13(5):R100. doi: 10.1186/bcr3041. [DOI] [PMC free article] [PubMed] [Google Scholar]
- 37.Ghosh K, Vachon CM, Pankratz VS, Vierkant RA, Anderson SS, Brandt KR, Visscher DW, Reynolds C, Frost MH, Hartmann LC. Independent Association of Lobular Involution and Mammographic Breast Density With Breast Cancer Risk. J Natl Cancer Inst. 2010 doi: 10.1093/jnci/djq414. [DOI] [PMC free article] [PubMed] [Google Scholar]
- 38.Lambe M, Hsieh CC, Chan HW, Ekbom A, Trichopoulos D, Adami HO. Parity, age at first and last birth, and risk of breast cancer: a population-based study in Sweden. Breast Cancer Res Treat. 1996;38(3):305–311. doi: 10.1007/BF01806150. [DOI] [PubMed] [Google Scholar]
- 39.Ewertz M, Duffy SW, Adami HO, Kvale G, Lund E, Meirik O, Mellemgaard A, Soini I, Tulinius H. Age at first birth, parity and risk of breast cancer: a meta-analysis of 8 studies from the Nordic countries. Int J Cancer. 1990;46(4):597–603. doi: 10.1002/ijc.2910460408. [DOI] [PubMed] [Google Scholar]
- 40.Colditz GA. Epidemiology of breast cancer. Findings from the nurses' health study. Cancer. 1993;71(4 Suppl):1480–1489. doi: 10.1002/cncr.2820710413. [DOI] [PubMed] [Google Scholar]
- 41.Haars G, van Noord PAH, van Gils CH, Grobbee DE, Peeters PHM. Measurements of Breast Density: No Ratio for a Ratio. Cancer Epidemiology Biomarkers & Prevention. 2005;14(11):2634–2640. doi: 10.1158/1055-9965.EPI-05-0824. [DOI] [PubMed] [Google Scholar]
Associated Data
This section collects any data citations, data availability statements, or supplementary materials included in this article.