FIG.4.
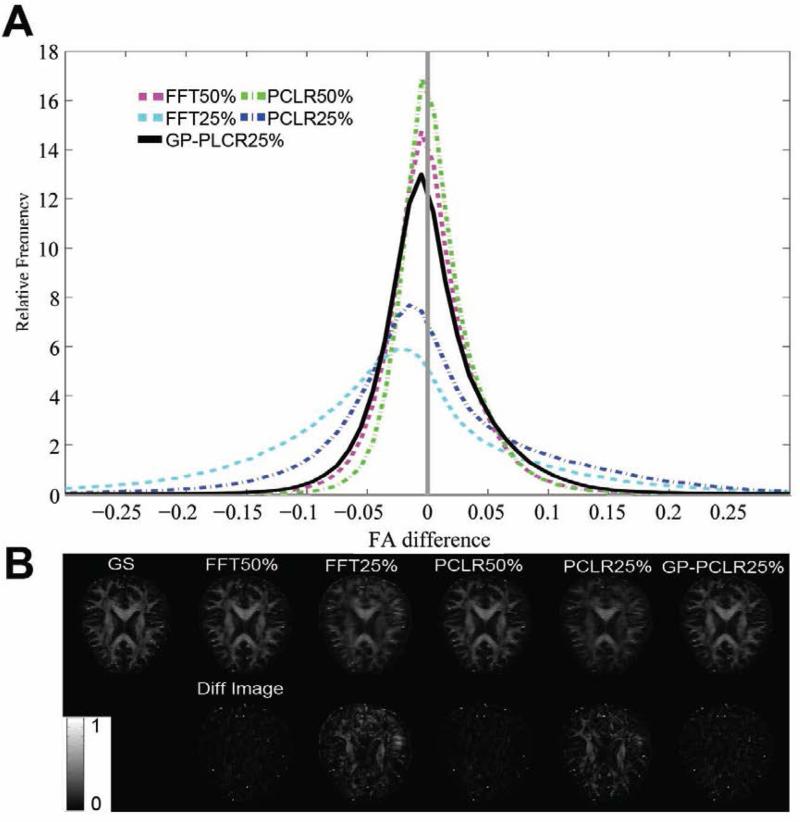
The FA differences between the reconstructed FA and the ground truth in the whole brain using different methods (FFT, PCLR, GP-PCLR) and undersampling rates (50%, 25%). Normalized histogram of FA differences across different methods and sampling rates are shown in (A). A narrow peak with a high relative frequency centered near zero indicates small differences between the ground truth and the reconstructed FA. PCLR25% and FFT25% tend to overestimate FA, whereas GP-PCLR25% showed close performance as that of FFT50%. The reconstructed FA maps (upper row) and the FA difference (lower row) in a representative slice are shown in (B). Compared to PCLR25% and FFT25%, GPPCLR25% showed less differences and the errors tend to be more homogenous across the brain than the former two methods. The FA differences were magnified twice for easy visualization. Note that FA is the ratio of anisotropic diffusion and therefore is unitless.

