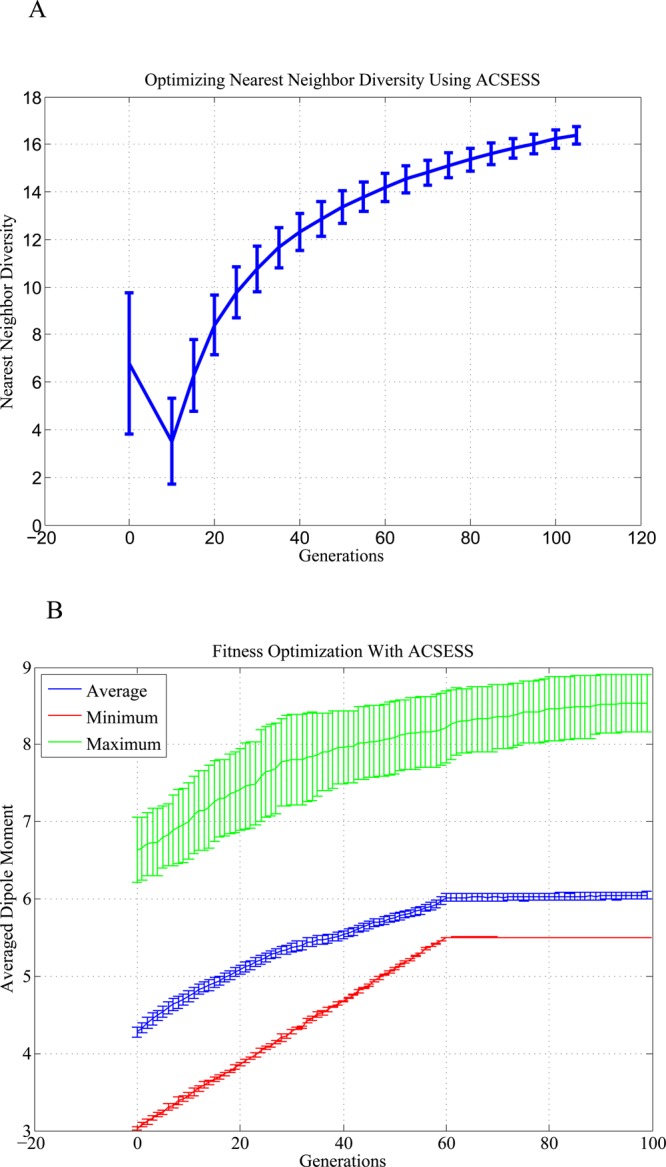
Figure 5.

Progress of ACSESS runs that sample GDB-9. The plots show the mean of the dipole moments from multiple runs, and the error bars represent one standard deviation from the mean of either nearest-neighbor distance or dipole moment. (A) Initially, a maximally diverse set (measured by nearest-neighbor distance) is generated. (B) The maximally diverse set is used to maximize their dipole moments. The minimum dipole moment found after 60 iterations is the desired dipole moment threshold (i.e., the top 10% fittest molecules).
