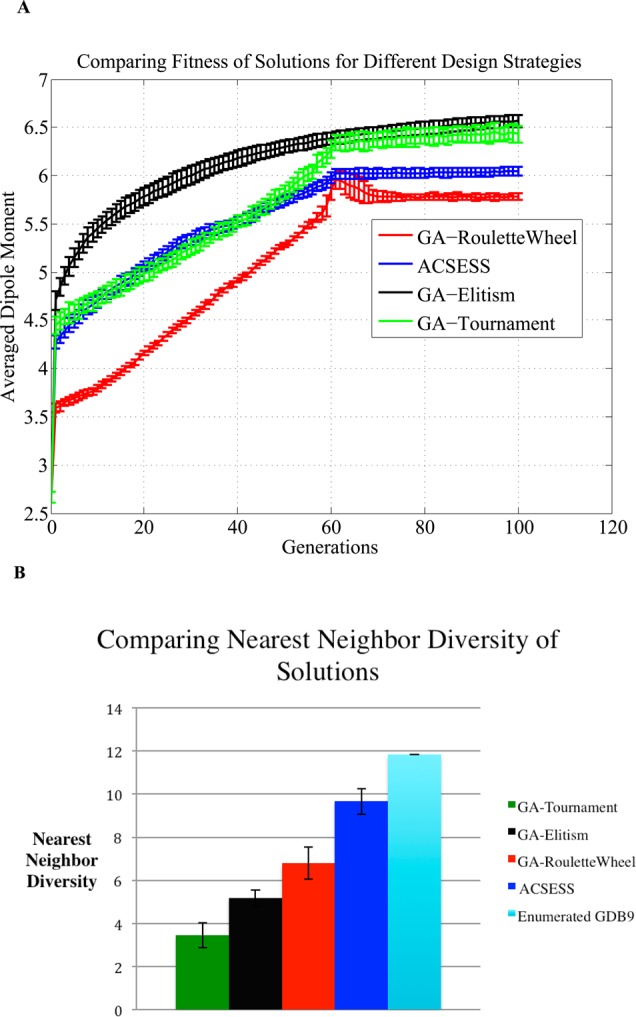
Figure 6.

ACSESS and SGAs runs that maximize the dipole moments (fitness) of diverse molecules. The two plots track the average fitness of libraries generated by each design algorithm (color coded differently), and the error bars represent one standard deviation from the mean for multiple runs. (A) compares the fitness of the library optimized using ACSESS with three other genetic algorithms (colored coded differently). (B) compares the diversity of the fit libraries generated by ACSESS and SGAs.
