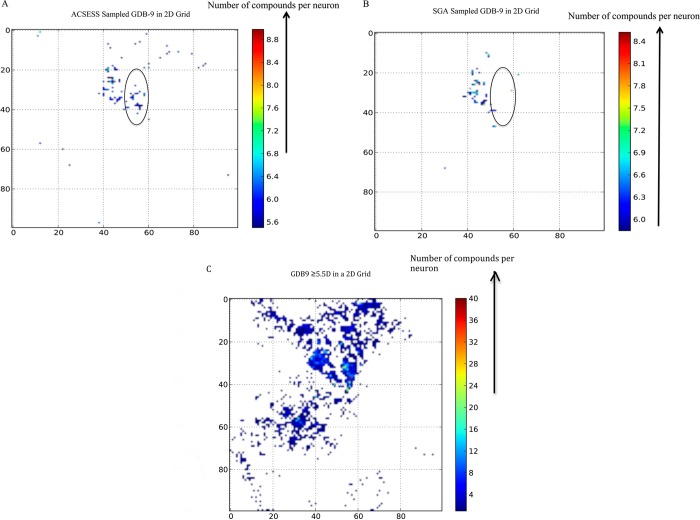
Figure 8.
Comparison of the diversity found in an ACSESS library and in an SGA-elitist library to the fully enumerated GDB-9 library. The color bars in A and B indicate the number of compounds per neuron. (A) shows the more fit molecules (molecules above the fitness cutoff) generated by ACSESS, (B) shows the more fit molecules (molecules above the fitness cutoff) generated by SGA (elitist), and (C) shows the fittest regions of GDB-9 (≥5.5D dipole moment) where the color bar represents the number of compounds per neuron. The oval indicates molecules in GDB-9 that are discovered using ACSESS but missed by SGAs.

