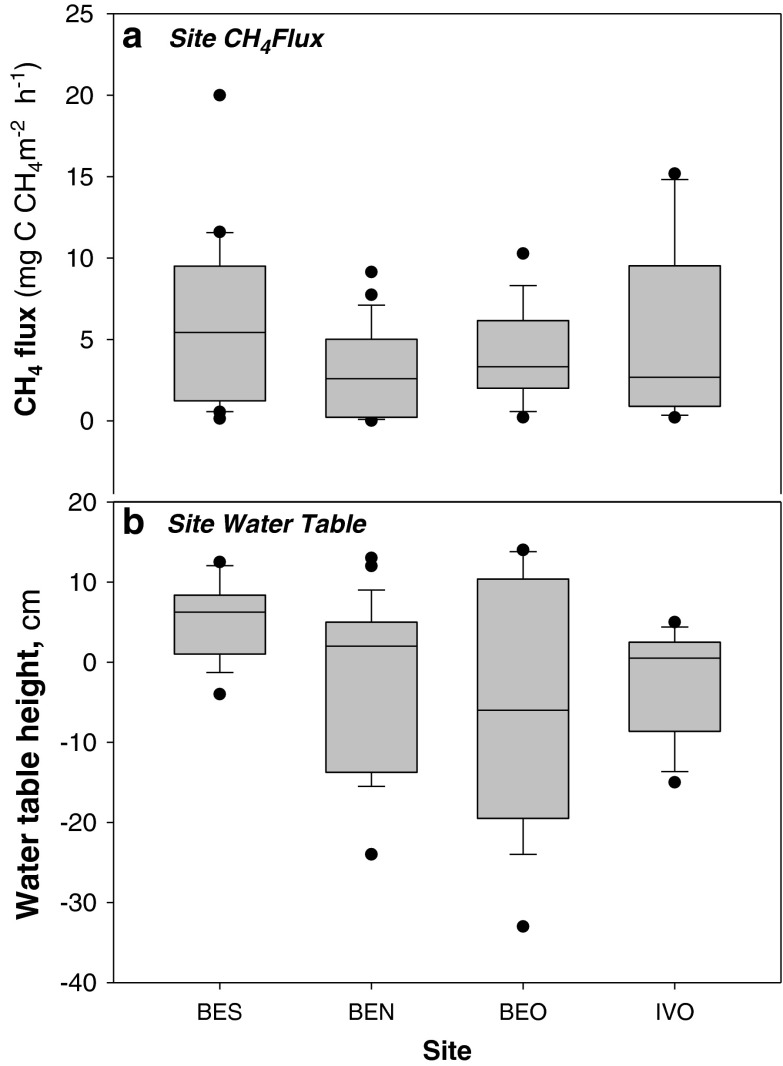
Fig. 2.
a) CH4 flux (mg C CH4 m−2 h−1) in August in BES (fairly flat, homogenous terrain) (n = 20, 1–25 August), BEN (low-centre, developed polygons) (n = 24, 1–25 August), BEO (high-centre, developed polygons) (n = 18, 6–26 August) in Barrow and Ivotuk (no substantial polygon development) (n = 11, on 18 August) and b) ground water table, cm, at sites BES (n = 18), BEN (n = 30), BEO (n = 20) in Barrow and Ivotuk (n = 12). Boxplots represent median (midline), quartiles (box), maximum and minimum (whisker) with outliers represented as black points

