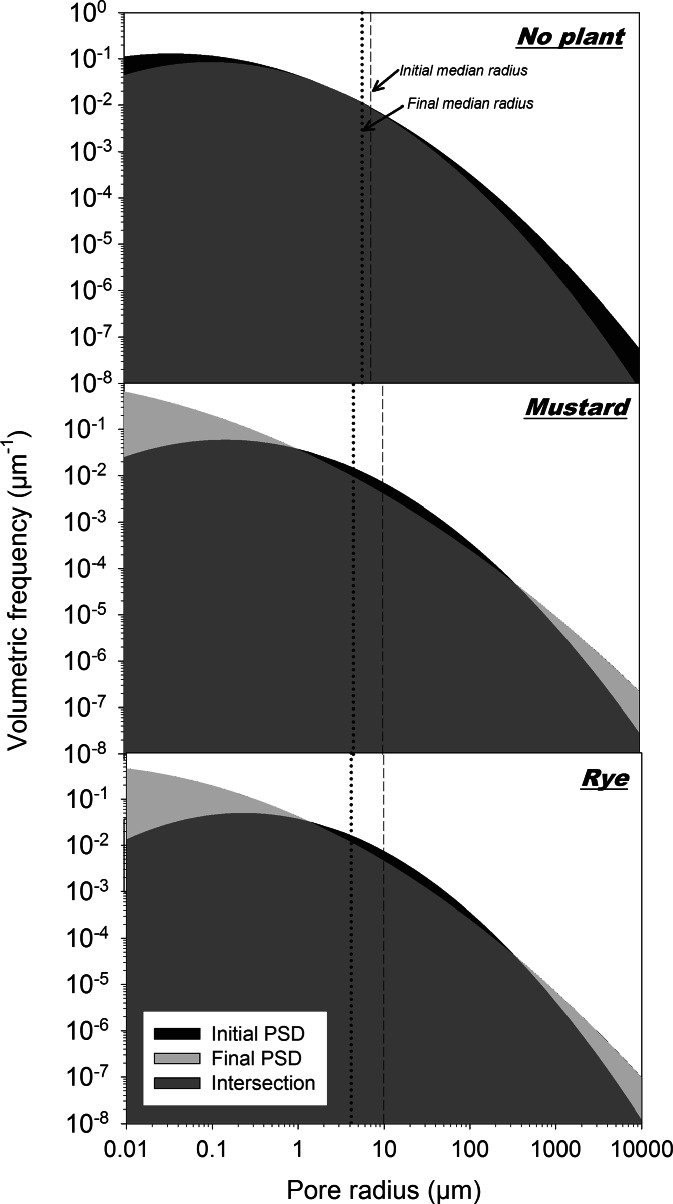
Fig. 5.
Pore size distribution (log-log scale) of the non-planted and planted (mustard, rye) soil columns at the initial (before planting) and final (with plant influence) state. Temporal changes in volumetric frequency at different pore radius classes are highlighted (black colour: decreasing frequency, light grey colour: increasing frequency)

