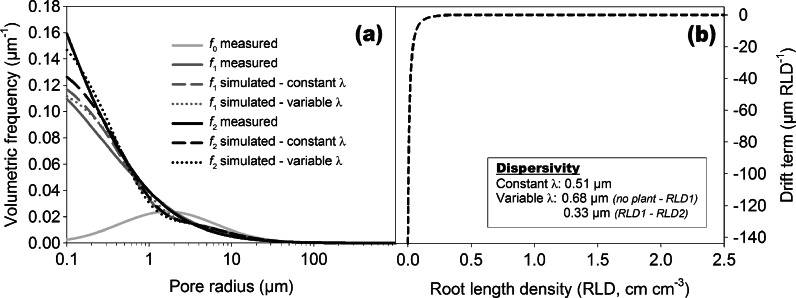
Fig. 6.
Measured (solid lines) and simulated (short dashed lines) pore size distributions (PSD) of non-planted and planted soil columns (Mean and 95 % confidence bands). Simulation was done by a pore evolution model calculating the temporal change between an initial (grey line) and final state (black lines)

