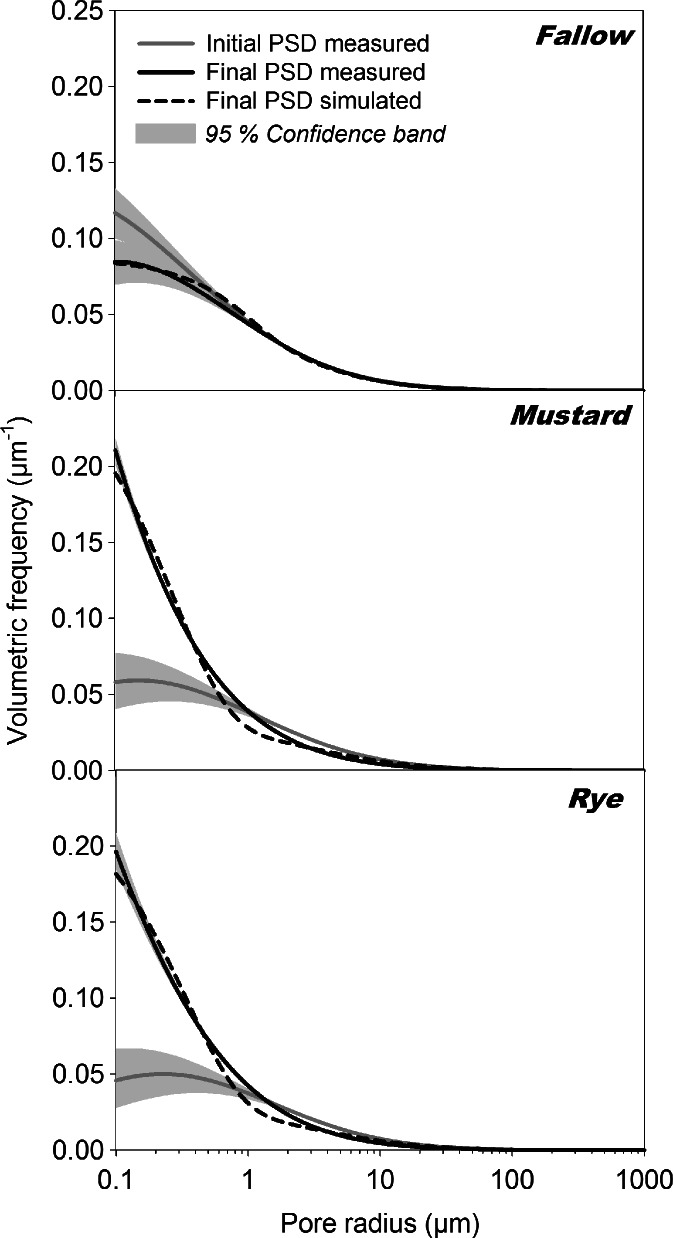
Fig. 7.
a Measured (solid lines) and simulated (long dashed and dotted lines) pore size distributions (PSD) showing the transition of a non-rooted to an increasingly rooted soil. Simulation was done with a pore evolution model using constant (long dashed lines) and variable (dotted lines) dispersivity. b Governing relations (drift function and dispersivity) for the pore evolution model

