
Fig. 2.
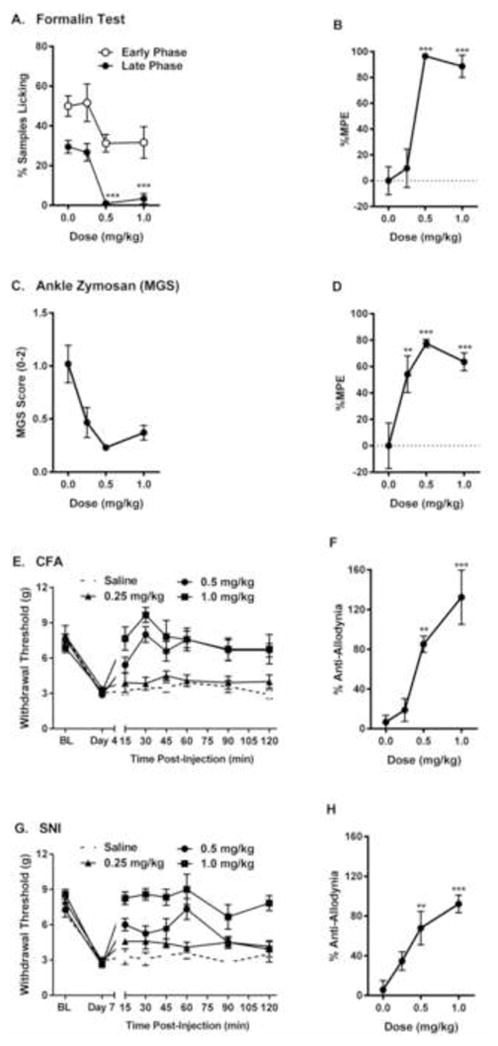
Dose-dependent analgesic effect of IBNtxA (0.25–1.0 mg/kg) in tonic (A, B, Formalin test; C, D, ankle zymosan test) and chronic pain (E, F, complete Freund’s adjuvant inflammatory pain test; G, H, spared nerve injury neuropathic pain test) assays. Symbols in graphs on left represent mean ± SEM percent samples licking (A), facial grimacing score (MGS) (B), or withdrawal threshold (E, G). Symbols in graphs on right side represent mean ± SEM maximum possible effect (%MPE; see Materials and Methods for calculation definitions; late phase data only for formalin test). Sample sizes are n=6–8 mice/dose, except for n=5 in saline group in graphs G, H. The dotted lines indicate 0 %MPE.