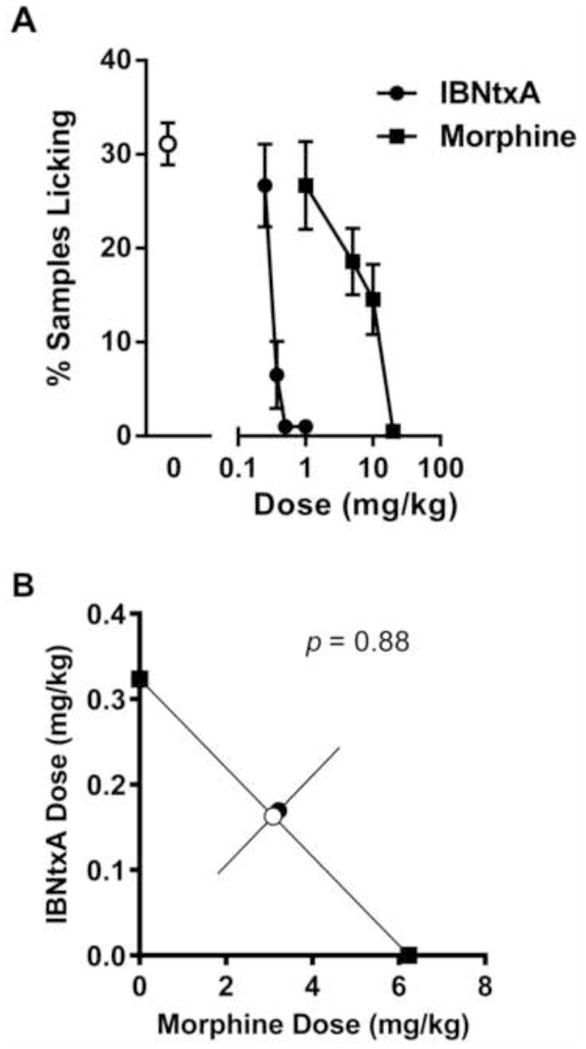
Fig. 3.

Additive analgesia between IBNtxA (0.25–1.0 mg/kg) and morphine (1–20 mg/kg) in the late phase formalin test. A) Dose-response curves for IBNtxA and morphine; symbols mean ± SEM percent samples featuring licking. B) Isobologram showing a perfectly additive relationship between the two analgesics in the late phase formalin test. Symbols represent individual drug AD50s (filled black squares) calculated from data in graph A, the theoretical AD50 of IBNtxA:morphine coadministration assuming additivity (open circle), and the experimentally determined AD50 of IBNtxA:morphine drug combinations (filled black circle). Sample sizes are n=4–10 mice/dose or dose combination.
