. 2015 Mar 24;45(2):131–140. doi: 10.4070/kcj.2015.45.2.131

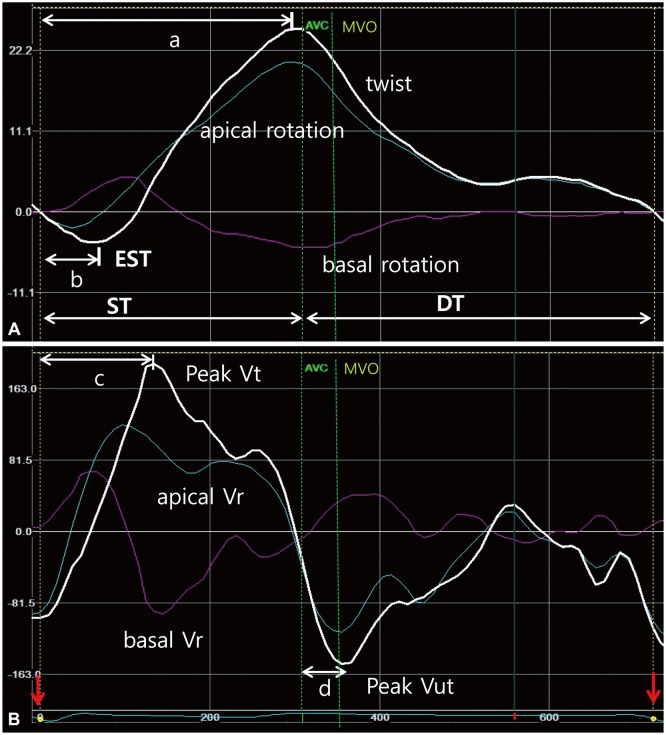
Fig. 1. Representative curves of left ventricular (LV) torsion movement. A: LV apical and basal rotation, and twist curves. Positive values express counterclockwise rotation or twist as seen from the apex. During early systole including isovolumetric contraction time, LV twists in opposite direction (early systolic twist, EST) of a dominant LV systolic twist during mid- or late systole. B: LV basal and apical rational velocity (Vr), and peak twist (Vt) and untwist (Vut) velocity curves. Peak twist velocity is observed at around a half of systolic time, whereas peak untwist velocity is seen during early diastolic period. Red arrows indicate the reference point of starting cardiac cycle (Q-wave). AVC: aortic valve closure, MVO: mitral valve opening, ST: systolic time, DT: diastolic time, a: time to peak systolic twist, b: time to peak EST, c: time to peak Vt during systole, d: time to peak Vut during diastole.

Fig. 1