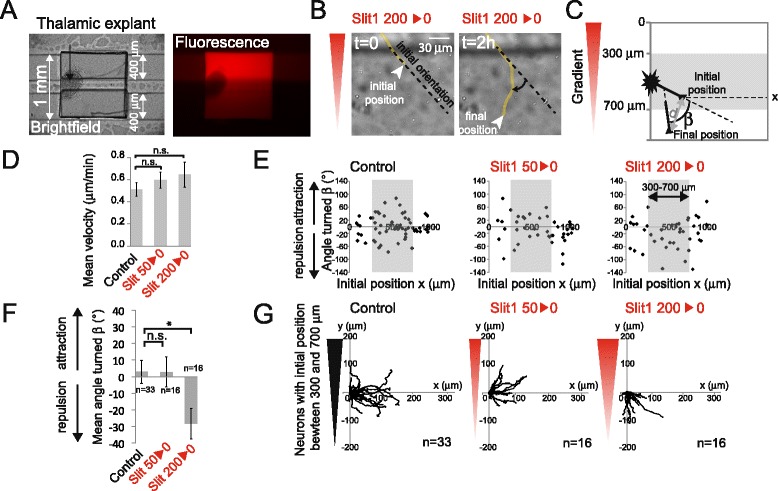
Figure 2.

Slit1 is repulsive for rostral thalamic axons at high concentration. (A) Brightfield image (left) of a typical experiment showing the explant cultured in a microwell on top of the microfluidic channels and the corresponding fluorescence image (right). (B) Example of a growing axon turning down a Slit1 gradient. (C) Defining the angle turned (β), the distance between initial/final position (d), and the initial position (x). The angle turned was defined as positive for turns towards the gradient and negative for turns away from the gradient. (D) The mean velocity (± standard deviation) defined as the distance ‘d’ divided by the time. n.s.: P > 0.05, Mann–Whitney test in which each condition is compared to the control. (E) Scatter plot of the angle turned versus the initial position (x). (F) The mean angle turned (β) (±SEM) for axons in the different conditions, for initial positions between 300 and 700 μm. Statistical differences are indicated *P < 0.05, Kruskal Wallis test with Dunn’s correction. (G) Trajectory plots of growth cones in the different conditions, for initial positions between 300 and 700 μm.
