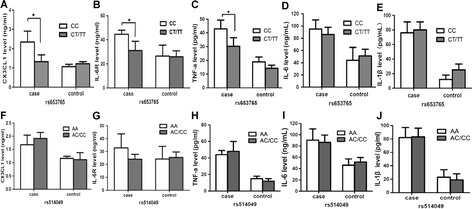
Figure 3.

The genotype distribution between the rs653765 polymorphisms and the expression of CX3CL1 (A), IL-6R (B), TNF- α (C), IL-6 (D) and IL-1 β (E) in severe sepsis patients and controls, and genotype distribution between the rs514049 polymorphisms and the expression of CX3CL1 (F), IL-6R (G), TNF- α (H), IL-6(I) and IL-1 β (J) in severe sepsis patients and controls. The horizontal line represents the mean expression level of ADAM10 with each group. *P <0.05; **P <0.01; ***P <0.001.
