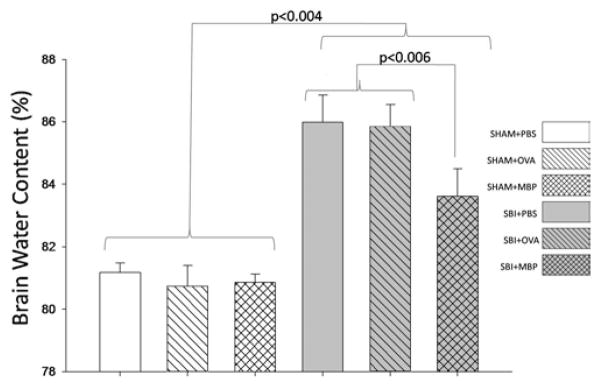
Fig. 3.

Graph comparing brain water content 48 hours after SBI among 6 groups of mice (6 mice per group for all groups except SBI + OVA and SBI + MBP [8 mice per group]). Brain water content was unchanged among treatments in the sham groups. Surgical brain injury caused significant increases in brain water content among all treatment groups. The postoperative increase in brain water content was significantly reduced in MBP-tolerant mice compared with vehicle (PBS) and ovalbumin groups. The Holm-Sidak test for pairwise comparisons was performed and the p values were less than the critical levels indicated in the figure (statistically significant).
