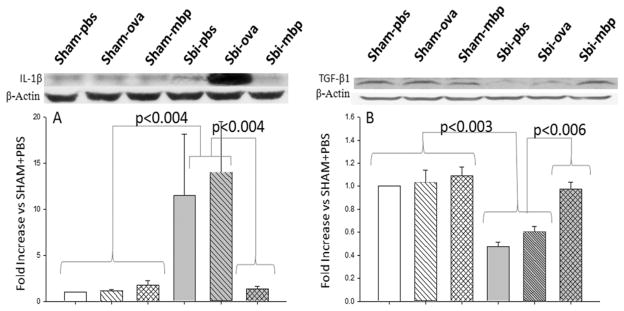
Fig. 4.

Graph showing the effects of mucosal tolerance on cerebral cytokine levels following SBI among 6 groups of mice (6 mice per group). Left: Levels of IL-1β were equal among all sham groups. Levels were significantly increased in the SBI + PBS and SBI + OVA groups. The MBP-tolerant mice did not demonstrate an increase in IL-1β after SBI. Levels of IL-1β were significantly higher in the SBI + PBS and SBI + OVA groups compared with the SBI + MBP group. Right: Levels of TGFβ1 were equal among all sham groups. Levels of TGFβ1 were reduced by approximately 50% in the SBI + PBS and SBI + OVA groups. There was no reduction in TGFβ1 in MBP-tolerant mice after SBI. Post-SBI levels of TGFβ1 were significantly higher in the MBP-tolerant mice than in the SBI + PBS or SBI + OVA groups. Expression levels of each protein using Western blots are expressed as a ratio of β-actin levels for normalization. The Holm-Sidak test for pairwise comparisons was performed and the p values were less than the critical levels indicated in the figure (statistically significant).
