Figure 1.
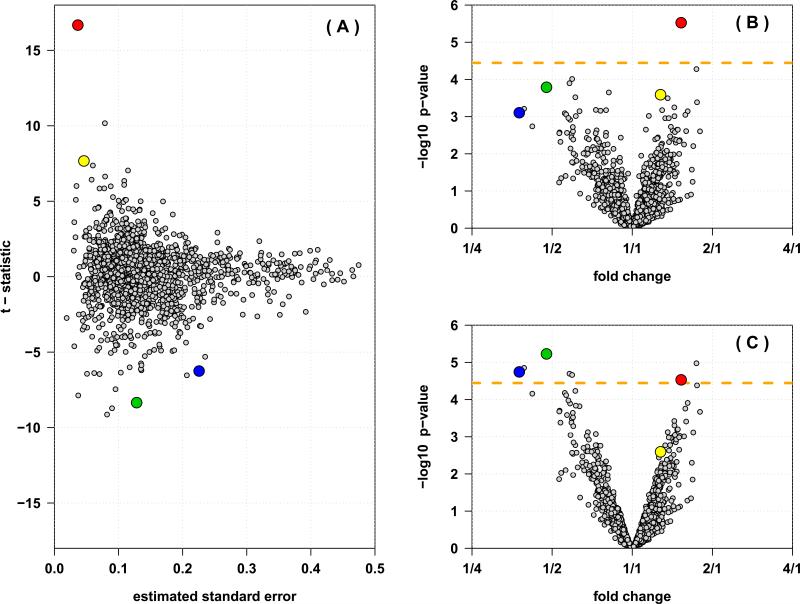
Inference from an 8-plex iTRAQ experiment with four cases and four controls, with 1,394 proteins identified and quantified. (A) The estimated standard error (x-axis) versus the t-statistic (y-axis) for each protein. The largest t-statistics (and thus, most significant p-values) tend to be from those proteins that show the smallest sample variability. (B) The volcano plot showing the estimated fold changes (x-axis) versus the − log10 p-values (y-axis) for each protein. (C) The volcano plot from the inference based on the moderated t-statistics. Four proteins are highlighted in each panel, illustrating how proteins with small sample variability can show very low p-values despite small fold changes (red and yellow), while proteins with larger fold changes do not necessarily show significant differential expression (green and blue). The Bonferroni corrected significance level is indicated by the orange line. Pooling information from the entire distribution of all proteins improves power to detect differentially expressed proteins, and reduces statistical significance of proteins with small sample variability.

