
Figure 3.
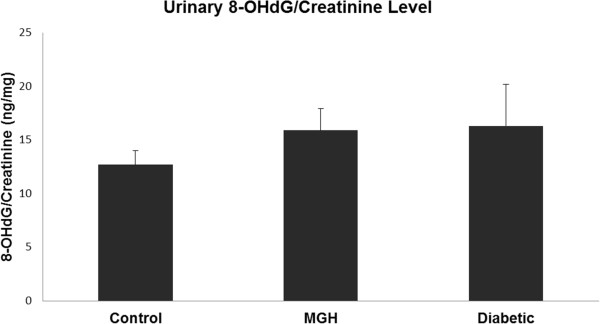
8-OHdG concentrations (ng/mg creatinine) in the study groups. Data presented as mean ± standard deviation of mean (Tukey’s multiple comparison test). p > 0.05 - No significant difference.
Official websites use .gov
A
.gov website belongs to an official
government organization in the United States.
Secure .gov websites use HTTPS
A lock (
) or https:// means you've safely
connected to the .gov website. Share sensitive
information only on official, secure websites.
8-OHdG concentrations (ng/mg creatinine) in the study groups. Data presented as mean ± standard deviation of mean (Tukey’s multiple comparison test). p > 0.05 - No significant difference.