
Figure 1.
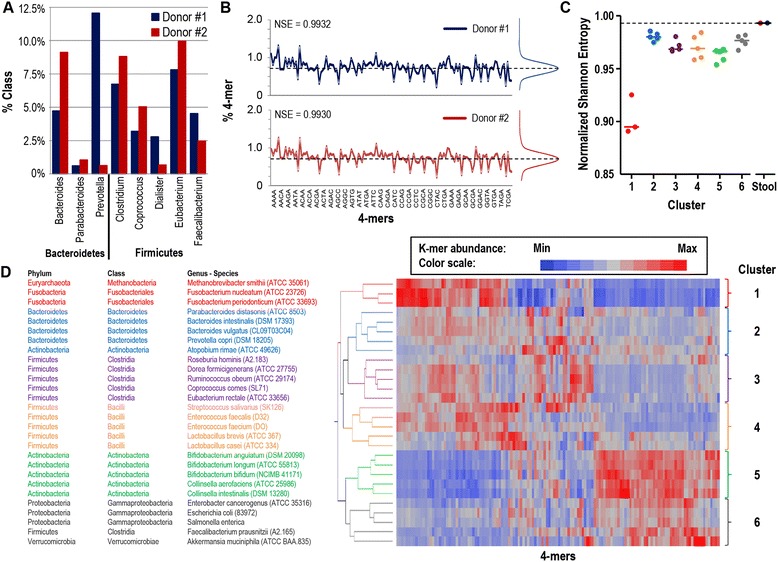
4-mer distribution analysis for complex microbiota metagenomes compared to individual bacterial genomes. A, Bar diagram of quantitative metagenomics of gut microbiota from two healthy volunteers, donor #1 (blue) and #2 (red), aggregated to express the frequency of a selected number of taxonomic classes from the Bacteroidetes and Firmicutes phylums. B, Line graph showing the 4-mer distribution of metagenomic sequences from gut microbiota of donor #1 and #2. A histogram depicting the 4-mer abundance distribution is plotted to the right of the line graph. Distribution entropy is indicated (normalized Shannon Entropy). C, Scatter plot visualizes the 4-mer distribution entropy for 28 bacterial genomes and two gut microbiota metagenomes. D, The 28 bacterial genomes are divided into 6 objective clusters by non-supervised agglomerative hierarchical cluster analysis of metagenomic 4-mer distributions based on Ward’s minimum variance method.